
Datasheet


4. Set the Sample Rate
to 1,000,000.
5. Press the MENU key.
6. Select Reading Buffers.
7. Set the Capacity to 10,000
for 10ms of readings.
8. Press the MENU key.
9. Select Graph.
10. Select the Scale tab.
11. Set the X-Axis
Method to All.
12. Select the Trigger tab.
13. Set Source Event to Waveform.
14. Select Analog Edge.
15. Set Level to 3 V.
16. Set Position to 50% for the pre-trigger position.
17. Select the Graph tab to view the graph.
18. To start capturing the buck converter power-up behavior,
press the TRIGGER key on the front panel.
The pre-trigger data acquisition starts immediately and is
displayed on the Graph. Turn on the input supply. When the
buck converter output voltage crosses the 3V trigger level, the
DMM acquires the remaining 50% of readings until it returns
to IDLE.
Figures 2
through
4
are a variety of power-up screen
captures from the buck converter under different supply
conditions. All figures contain both a trigger position indicator
(▼) and a trigger level control line. You can slide this dashed
line up or down to adjust the trigger level and start another
acquisition.
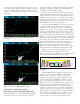
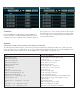
Figure 2
illustrates clean power-up and power-down events
when input and load conditions are optimal. The result is a
monotonic rise or fall of the buck converter output.
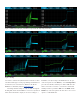
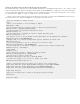
Figure 3
illustrates possible abnormal power-up behavior from reduced
input current limits. The waveform on the left shows a drop in
the output voltage as a result of the insufficient in-rush current
required by the initial input capacitor. The waveform on the right
never recovers and the output oscillates below the expected 5V
output value.
Figure 4
illustrates several phenomena, including a soft-start
staircase sequence, a normal output ramp, and a slight overshoot
toward the end of power-up. The Model DMM7510 combines
the dynamic measurement range, 18-bit resolution, and a huge
reading buffer to maximize the effectiveness of the digitizer.
With a single trigger acquisition, the entire power-up is captured
with millivolt accuracy, which can reveal the tiniest irregularity
Figure 3. Examples of power-up anomalies (temporary output voltage dip on the left and permanent failure to power-up on the right) on the buck converter.
Figure 2. Monotonic power-up (left) and power-down (right) behavior on the buck converter.