
Datasheet
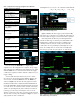
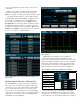
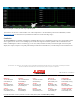
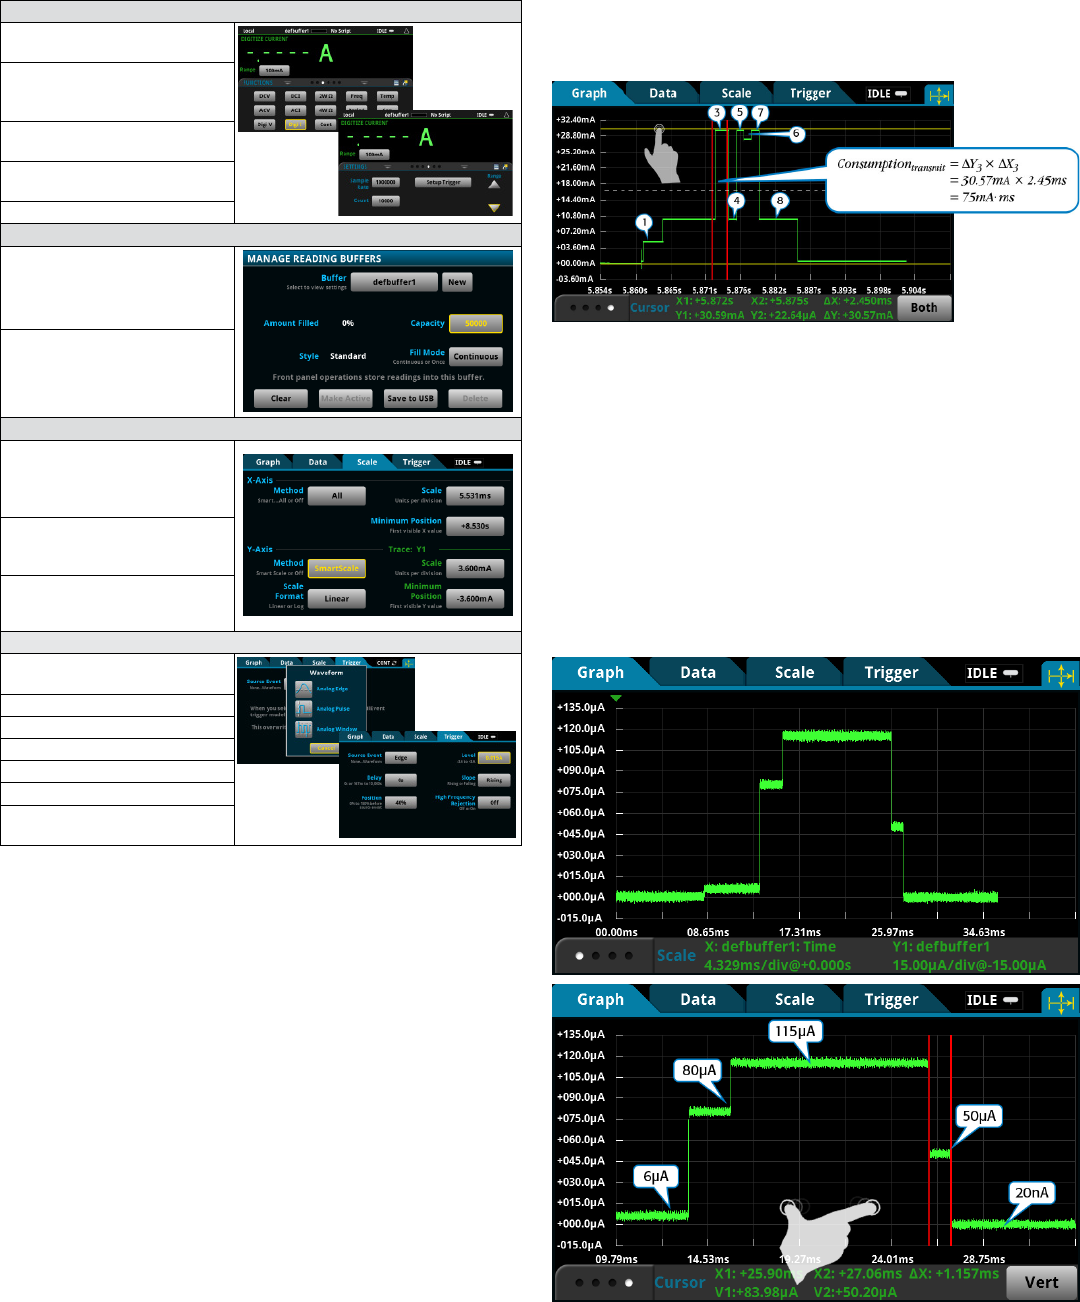
Table 1. Configurations for Edge Triggered Digitize Current Waveform
Configure measurement function
Push the HOME key on the
front display.
On the FUNCTIONS swipe
screen, select Digi I to select the
Digitize Current function.
Push the Range button to select
100mA range.
Swipe to display the SETTINGS
swipe screen.
Set the Sample Rate to 1,000,000.
Configure acquisition span
Press the MENU key and select
Reading Buffers.
Set the Capacity to 50,000 for
50ms of readings.
Configure graph scale
Press the MENU key and
select Graph.
Select the Scale tab.
Set the X-Axis Method to All.
Configure trigger mechanism
Press the MENU key and
select Graph.
Select the Trigger tab.
Set Source Event to Waveform.
Select Analog Edge.
Set Level to 15m A.
Set Slope to Rising.
Set Position to 40% for the pre-
trigger position.
Press the front panel TRIGGER key to begin a single
acquisition once all configurations are complete. The pre-trigger
data acquisition starts immediately and is displayed on the graph.
When the DMM detects a current level that satisfies the trigger
condition, the acquisition continues until the completion of post-
trigger readings.
You can enable horizontal and vertical cursors to obtain
the current over various time intervals.
Figure 2
illustrates the
cursor feature on the Model DMM7510. Press the MENU key
and select Graph. Swipe the bottom of the graph screen until
the Cursor enable button is displayed. Push the Cursor button
repeatedly until Both is displayed. Push and drag the horizontal
or vertical cursors across the waveform to measure current (∆Y)
and the corresponding interval (∆X). As with most touchscreen
technology, you can easily zoom and pan to any area on the
display to position the cursors more accurately on the waveform.
The total active current peak consumption in
Figure 2
consists of
eight segments. It can be calculated as:
Consumption
totalactivecurrentpeak
= Current
k
× Time Interval
k
n
k=0
Σ
= ∆Y
1
× ∆X
1
+ ∆Y
2
× ∆X
2
+ … + ∆Y
8
× ∆X
8
where n = 8
Figure 2. Power analysis using cursors.
Figures 1 and 2
both show a trigger position indicator (▼)
and a trigger level control line. You can slide this dashed line up
or down to adjust the trigger level and start another acquisition.
New developments in ultra-low power management have
introduced a wide range of ultra-low power MCU families that
implement more sophisticated strategies for limiting power
consumption with several levels of low power modes. This
results in finer levels of granularity beyond simply run or idle
modes. For example, there are modes such as standby mode,
doze mode, sleep mode, deep sleep mode, etc, with current
Figure 3. Example of a multi-level idle mode current pulse profile (top).
Power analysis using cursors (bottom).