
Datasheet

the waveform.
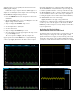
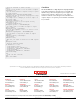
Figure 4
highlights some of the multi-touch
interactions that you are able to perform on the Model
DMM7510 touchscreen.
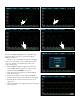
The cursors are conveniently located in one of the graph
swipe screens. Follow these steps to enable the horizontal
cursors for obtaining a quick visual ripple peak-to-peak
voltage measurement:
1. Push the CONT (Continuous) trigger mode indicator to
select the MAN (Manual) trigger mode. This stops data
acquisition until the TRIGGER key is pressed.
2. Swipe the bottom of the graph screen until the Cursor
enable button appears.
3. Push the Cursor button a couple of times until Horiz is
displayed. The horizontal cursors will appear on the graph.
4. Push and drag the yellow horizontal cursor lines to the
ripple peaks.
5. The ∆Y value shown on the graph swipe bar gives the ripple
peak-to-peak value.
Figure 4c. Data point.
Figure 4d. Horizontal cursors.
Figure 4a. Zooming.
Figure 4b. Panning.