
Instructions

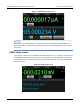

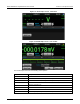


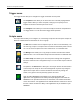
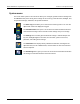

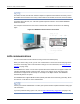
Table Of Contents
- Model DMM6500 6½-Digit Multimeter User's Manual
- 1 Introduction
- 2 Front-panel overview
- 3 Using a remote interface
- 4 Making basic front-panel measurements
- 5 Measuring DC voltage with high accuracy
- 6 Measuring 4-wire resistance with offset compensation
- 7 Scanning temperature at a set time interval
- 8 Grading and binning resistors
- 9 Measuring power using digitizing and TSP-Link
- 10 Troubleshooting FAQs
- About this section
- Where can I find updated drivers?
- Is there any software to help me get started?
- Why did my settings change?
- Why can't the DMM6500 read my USB flash drive?
- How do I upgrade the firmware?
- How do I change the command set?
- How do I save the present state of the instrument?
- How do I save what is displayed on the screen?
- What is the ethernet port number?
- 11 Next steps
- Contact information

Model DMM6500
6½ Digit Multimeter User's Manual Section 2: Front-
panel overview
DMM6500-900-01 Rev. B / August 2019 2-15
Measure menu
The Measure menus allow you to select, configure, and perform measure operations from the front
panel.
The QuickSet menu allows you to change the function and adjust performance.
The Measure Settings menu contains settings for the presently selected measure
function, which is identified by the function indicator in the upper right corner of the
menu. The available settings depend on the front-panel FUNCTION key selection.
The Calculations menu contains settings that specify the way measurement
information is processed and returned.
The Config Lists menu allows you to select an existing measure configuration list,
create a new list, load configuration settings to and from the instrument, and view
the settings of an index in a configuration list.
The Reading Buffers menu allows you to view the list of existing reading buffers
and select one to be the active buffer. You can also create, save, delete, resize,
and clear buffers from this screen.
Views menu
The Views menus allow you to select, configure, and view data that was gathered from measure
operations.
The Graph menu opens a screen that displays a graph of the measurements in
selected reading buffers as traces. It also contains tabs that you use to customize
the graph display.
You can also select the trigger mode and initiate the trigger model or scan from this
screen.
The Histogram menu allows you to graph the distribution of measurement data in
the selected reading buffer. It also contains tabs that you use to customize the
histogram.
This menu allows you to view data in the selected reading buffer.