
User manual

Section
4: KI-Link KI-Tool And KI-Link Software
User's Manual
4-10 2110-921-01 Rev. B / August 2013
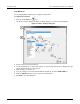
Logging Charts
Use Logging Charts to set up data logging and display it on a chart.
Click the Logging Charts
icon.
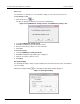
The KI-Link software displays the Set up/Run Logging Worksheet dialog box. This dialog box has two
tabs:
• Logging
• Chart
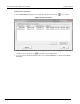
Logging
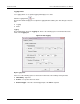
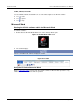
The following figure shows the Logging tab. Refer to the following topics for information about the
fields on the Logging tab.
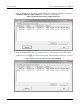
Figure 34: Data logging
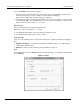
Begin Logging Data
Select one of the following options to instruct the instrument to take readings and log the data.
• Immediately - right now
• At Time - at a specific time in the future
• External Trigger - when the external trigger input of the DMM is signaled