
User manual

Section
3: KI-Tool KI-Tool And KI-Link Software
User's Manual
3-20 2110-921-01 Rev. B / August 2013
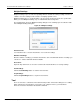
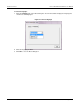
Graph
The KI-Tool software graphs the data and displays the chart.
Drawing
Use the Drawing button to instruct the KI-Tool software to create the chart based on the selections in
the Settings.
2ND Drawing (if equipped)
If the record you are charting has a 2ND function measurement, use the 2ND Drawing button to plot
the 2ND function measurement readings.
Clear
Use the Clear button to reset the display to blank.
Exit
Use the Exit button to close the Chart Record window.
Data Selection Slider
Use the Data Selection Slider to step through data points.
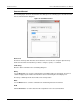
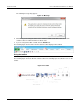
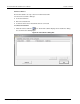
Operation
The Operation menu instructs the instrument to start or stop taking measurement readings.
The Operation menu has three selections:
• Multiple Readings (on page 3-21)
• Start Readings (on page 3-21)
• Stop Readings (on page 3-21)