
User manual

KI-Tool And KI-Link Software User's Manual Section 3: KI-
Tool
2110-921-01 Rev. B / August 2013 3-19
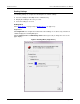
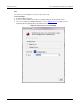
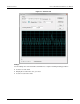
The following figure shows the Settings area. Refer to the following topics for descriptions of the
settings.
Figure 16: Settings
Select Record
Open the drop-down menu and select a previously saved record you want to chart.
Data Quantity
This field displays the number of readings in the selected record.
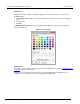
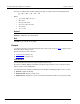
Change Color
Click the Change Color button to display the color palette.Select the color for the record display.
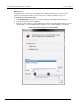
Y-Scale
Open the drop-down menu and select the appropriate Y-Scale (vertical) measurement unit for the
chart.
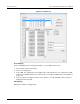
Drawing with all
Select Drawing with all to use all readings in the record to draw the chart.
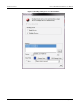
Drawing data from
Select Drawing data from to choose a section of readings in the record to graph.
1. Enter the reading number of the first entry for the graph.
2. Enter the reading number of the last entry for the graph.
For example, if the Data Quantity is 22, you can use this selection to start the chart at reading number
12 and end it at reading number 20.
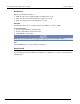
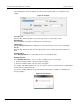
If you enter a reading number that is greater than the total number of readings, the following error
message displays.
Figure 17: KI-Tool Error