
User manual

KI-Tool And KI-Link Software User's Manual Section 3: KI-
Tool
2110-921-01 Rev. B / August 2013 3-3
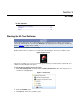
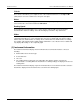
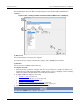
(1) Menu bar
The menu bar provides menus and buttons to configure and run the KI-Tool software. The menu bar
is located at the top of the user interface. Refer to Menus (on page 3-6
) for information about the
menus on the menu bar.
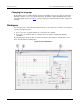
(2) Toolbar
The toolbar contains tools to control the KI-Tool software operation and to set up functions.
Click the start icon to start plotting data on the graph.
Click the stop icon to stop plotting data on the graph.
Click the settings icon to open the Device Settings (on page 3-7) menu.
(3) Instrument List
For each instrument connected to the computer, the Instrument List:
• Identifies the instrument by its model number and connection type
• Shows the present function and range selected
• Model 2110 only: Provides a drop-down menu to select a second measurement (2ND) function
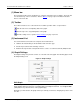
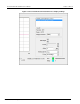
(4) Graph Settings
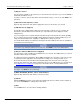
The Graph Settings area provides controls to scale and control the graph. The following figure shows
the Graph Settings area.
Figure 5: Graph Settings
Shift Graph
The Shift Graph control allows you to shift positions of the lines on the graph. This feature is useful
when graphing dual measurements or graphing data from multiple instruments. Use the Up and Dn
(down) buttons to position the lines on the graph display.
Each time you click a button, the graph shifts up or down by one division, changing the position of the
zero-line.