
User manual


Front Panel Operation
2001-900-01 Rev. J / October 2009 3-7
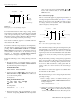
Bar graph
The “normal” bar graph, with a zero at the left end, is a graphical representation of a reading as a portion of a range. (See Figure
3-3.) The vertical lines displayed along the bar designate 0%, 25%, 50%, 75%, and 100% of full scale. Each full segment of the
bar represents approximately 4% of the range limit.
q~ÄäÉ=PJP
Multiple displays by function
Function Next display Paragraph
All Bar graph
Zero-centered bar graph
Maximum and minimum values
Relative and actual values
Calculated and actual values (see Note 1)
Limits bar graph (see Note 1)
Adjacent channel readings (see Note 2)
3.3.2
3.3.2
3.3.2
3.6
3.10
3.12.5
3.10
DC voltage DC volts, AC ripple voltage and frequency
Positive peak spikes and highest value
Negative peak spikes and lowest value
Positive and negative peak spikes
3.4.1
AC voltage AC RMS voltage, frequency, and crest factor
AC RMS, average, and peak voltages
3.4.1
DC current (none specific to function) 3.4.2
AC current AC RMS (or average) current and frequency
AC RMS and average current
3.4.2
2-wire resistance Source current
Voltage drop across DUT
3.4.3
4-wire resistance Source current
Voltage drop across DUT
Lead resistance
3.4.3
Frequency Period calculation
Trigger level
3.4.4
Temperature Celsius, Fahrenheit, and Kelvin units
RTD resistance (or thermocouple voltage)
Reference junction (thermocouples only)
3.4.5
Data storage buffer Maximum and minimum values
Average and standard deviation
3.8
Notes:
1. Multiple displays for calculated values and limits bar graph are not available for the frequency function.
2. The multiple display for adjacent channel readings is not available for the DC and AC current functions.