
Users Manual Part 2


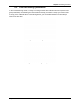

Table Of Contents
- Appendix B. Regulatory Compliance and Agency Approvals
- Chapter 1. Kaye ValProbe RT System
- Chapter 2. Kaye ValProbe RT Hardware
- Chapter 3. ValProbe RT System Connections
- Chapter 4. Creating User Accounts
- Chapter 5. Defining Equipment
- Chapter 6. Defining Assets
- Chapter 7. Defining Study Setups
- Chapter 8. Viewing Live Data
- Chapter 9. Qualification Study
- Chapter 10. Sensor Verification
- Chapter 11. Qualification Reports
- Appendix A. Specifications
- A.1 Kaye ValProbe RT System
- A.1.1 List of Certified Countries
- A.1.2 Regulatory Compliance
- A.1.3 RF System Operating Frequency and Modulation
- A.1.4 RF Channels
- A.1.5 RF Network Topology and PAN ID (Network ID)
- A.1.6 Antenna Diversity
- A.1.7 Data Rate and Data Encryption
- A.1.8 RF Range (Line of Sight and Outdoor)
- A.1.9 Number of Loggers and Sensors Supported
- A.1.10 Sensor Sampling Rate
- A.1.11 Data Transmission Rate
- A.1.12 Sensor Samples Data Storage Capacity
- A.1.13 Optional Extendable Base Station Antenna
- A.2 Kaye ValProbe RT Base Station
- A.2.1 Input Power and Adaptor Ratings
- A.2.2 Installation Category
- A.2.3 Overvoltage Category and Electrical Safety Protection Class
- A.2.4 Input DC Power On/Off Switch
- A.2.5 Front Panel LED Indications and Buzzer
- A.2.6 Bath and IRTD Interface Ports
- A.2.7 USB Port
- A.2.8 Ethernet Communication Port
- A.2.9 Reset Switch to Reload Default Factory Settings
- A.2.10 Wakeup Magnet
- A.2.11 Batteries
- A.2.12 Unit Dimensions
- A.2.13 Enclosure Material
- A.2.14 Environmental Ratings
- A.3 Kaye ValProbe RT Logger
- A.3.1 Installation Category
- A.3.2 Overvoltage Category and Electrical Safety Protection Class
- A.3.3 Magnetic Switch
- A.3.4 LED Indications
- A.3.5 Calibration
- A.3.6 Real Time Clock Accuracy
- A.3.7 Sensing Elements
- A.3.8 Housing Material
- A.3.9 Logger Base Dimensions
- A.3.10 Ingress Protection
- A.3.11 Insulating Canister X2545
- A.3.12 Battery
- A.3.13 Shelf Life
- A.3.14 Battery Life
- A.4.1 Measurement Accuracy
- A.4.2 Body Environmental Ratings:
- A.4.3 Number of Input Channels
- A.4.4 Sensor Types and Measurement Range
- A.4.5 Sensor Lengths
- A.5.1 Measurement Accuracy
- A.5.2 Body Environmental ratings:
- A.5.3 Number of Input Channels
- A.5.4 Sensor Types and Measurement Range
- A.5.5 Sensor Lengths
- A.6.1 Measurement Accuracy
- A.1 Kaye ValProbe RT System
- Appendix B. Regulatory Compliance and Agency Approvals
- B.1 Electrical Safety Approvals:
- B.2 Radio and EMC Certification Approvals:
- B.3 Ingress Protection for Kaye ValProbe RT Logger
- B.4 United States FDA 21 CFR Part 11 Complaint Software Application
- B.5 Transportation Regulations
- B.6 FCC Compliance Statement
- B.7 ISED Canada Compliance Statement
- B.8 EU Compliance Statement:
- B.9
- Product Certification Labels
- Appendix C. Environnemental Compliance
- Appendix D. Warranty and Returns:
- Appendix E. Service Information

Chapter 8: Viewing Live Data
Kaye ValProbe RT User Manual 76
Graph View
Pressing Graph View switches to real-time graphing of senor readings. The sensors are
organized in groups defined in the setup. The different groups can be selected by pressing the
buttons above the graph.
The Graph View is controlled with the buttons below the Graph. Zoom into the data via the
touch screen control. For easier operation, it is possible to zoom only X- or Y-axis by selection.
The Y-axis can be scaled manually by entering a min- and max-values and reset anytime to
automatic scaling again. For better visualization of the process specification two limit lines can
be set.
Inside the graph, the current max and min value is highlighted with red and blue line color
respectively and the sensor label, timestamp, and value are displayed. The current max and
min value are also listed in the calculations pane.
Figure 85: Qualification Study in Graph View