
Users Manual Part 2
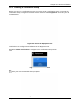


Table Of Contents
- Appendix B. Regulatory Compliance and Agency Approvals
- Chapter 1. Kaye ValProbe RT System
- Chapter 2. Kaye ValProbe RT Hardware
- Chapter 3. ValProbe RT System Connections
- Chapter 4. Creating User Accounts
- Chapter 5. Defining Equipment
- Chapter 6. Defining Assets
- Chapter 7. Defining Study Setups
- Chapter 8. Viewing Live Data
- Chapter 9. Qualification Study
- Chapter 10. Sensor Verification
- Chapter 11. Qualification Reports
- Appendix A. Specifications
- A.1 Kaye ValProbe RT System
- A.1.1 List of Certified Countries
- A.1.2 Regulatory Compliance
- A.1.3 RF System Operating Frequency and Modulation
- A.1.4 RF Channels
- A.1.5 RF Network Topology and PAN ID (Network ID)
- A.1.6 Antenna Diversity
- A.1.7 Data Rate and Data Encryption
- A.1.8 RF Range (Line of Sight and Outdoor)
- A.1.9 Number of Loggers and Sensors Supported
- A.1.10 Sensor Sampling Rate
- A.1.11 Data Transmission Rate
- A.1.12 Sensor Samples Data Storage Capacity
- A.1.13 Optional Extendable Base Station Antenna
- A.2 Kaye ValProbe RT Base Station
- A.2.1 Input Power and Adaptor Ratings
- A.2.2 Installation Category
- A.2.3 Overvoltage Category and Electrical Safety Protection Class
- A.2.4 Input DC Power On/Off Switch
- A.2.5 Front Panel LED Indications and Buzzer
- A.2.6 Bath and IRTD Interface Ports
- A.2.7 USB Port
- A.2.8 Ethernet Communication Port
- A.2.9 Reset Switch to Reload Default Factory Settings
- A.2.10 Wakeup Magnet
- A.2.11 Batteries
- A.2.12 Unit Dimensions
- A.2.13 Enclosure Material
- A.2.14 Environmental Ratings
- A.3 Kaye ValProbe RT Logger
- A.3.1 Installation Category
- A.3.2 Overvoltage Category and Electrical Safety Protection Class
- A.3.3 Magnetic Switch
- A.3.4 LED Indications
- A.3.5 Calibration
- A.3.6 Real Time Clock Accuracy
- A.3.7 Sensing Elements
- A.3.8 Housing Material
- A.3.9 Logger Base Dimensions
- A.3.10 Ingress Protection
- A.3.11 Insulating Canister X2545
- A.3.12 Battery
- A.3.13 Shelf Life
- A.3.14 Battery Life
- A.4.1 Measurement Accuracy
- A.4.2 Body Environmental Ratings:
- A.4.3 Number of Input Channels
- A.4.4 Sensor Types and Measurement Range
- A.4.5 Sensor Lengths
- A.5.1 Measurement Accuracy
- A.5.2 Body Environmental ratings:
- A.5.3 Number of Input Channels
- A.5.4 Sensor Types and Measurement Range
- A.5.5 Sensor Lengths
- A.6.1 Measurement Accuracy
- A.1 Kaye ValProbe RT System
- Appendix B. Regulatory Compliance and Agency Approvals
- B.1 Electrical Safety Approvals:
- B.2 Radio and EMC Certification Approvals:
- B.3 Ingress Protection for Kaye ValProbe RT Logger
- B.4 United States FDA 21 CFR Part 11 Complaint Software Application
- B.5 Transportation Regulations
- B.6 FCC Compliance Statement
- B.7 ISED Canada Compliance Statement
- B.8 EU Compliance Statement:
- B.9
- Product Certification Labels
- Appendix C. Environnemental Compliance
- Appendix D. Warranty and Returns:
- Appendix E. Service Information

Chapter 10: Sensor Verification
Kaye ValProbe RT User Manual 97
During the verification process, live data can be displayed in two ways, in a Graph view and a
List view. If the list exceeds the screen size, you can scroll vertically through the remaining
data. On the graph, temperature appears on the Y-axis, while the highlighted X-axis displays
the stabilized IRTD temperature. All sample points that lie within the deviation specified are
displayed as dots along with the label and the temperature point of the sensor. Samples that
deviate from specification are displayed as red dots along with a sensor label, temperature
point, and a value indicating how much the sensor is off.
Figure 110: Temperature Verification Graph View
The first step in the Verification process is to verify that the IRTD is stable. Stability is the
maximum allowable change in temperature for the temperature standard over the specified
time interval. The maximum allowable change in temperature for the IRTD is fixed at 0.012°C
if all temperature setpoints are equal to or greater than 0°C. If any temperature setpoint is
less than 0°C, it is possible to change the IRTD stability value manually in your setup.
The stability calculation begins once the temperature reference is within five degrees of the
setpoint. Sensor and IRTD readings are displayed on the Data screen. To achieve stability,
the IRTD must meet the stability criteria defined in the setup.
When the IRTD is stable the Stability textbox changes from red to green and a timestamp
appears in the Time of Stability textbox. At the same time, the duration of stability starts to
count the time at stability. If IRTD gets unstable, the process starts restarts. When duration of
additional time at stability meets the criteria the textbox changes to green and the setpoint is
considered fulfilled.
Each setpoint that has met the criteria is displayed in green. Once all setpoints are met, the Study
data from the Loggers can be read, click the green Read button to transfer the Logger and Base
Station data to the Validation Console. If the Read button is not green, the setpoints are not
completed.