
Datasheet


Page 13/19
Data Sheet 701155
V3.00/EN/00542385
70115500T10Z000K000
-802*PE+&R.*
'HOLYHU\DGGUHVV 0DFNHQURGWVWUDH
)XOGD*HUPDQ\
3RVWDODGGUHVV
)XOGD*HUPDQ\
3KRQH
)D[
(PDLO PDLO#MXPRQHW
,QWHUQHW ZZZMXPRQHW
-802,QVWUXPHQW&R/WG
-802+RXVH
7HPSOH%DQN5LYHUZD\
+DUORZ(VVH[&0'<8.
3KRQH
)D[
(PDLO VDOHV#MXPRFRXN
,QWHUQHW ZZZMXPRFRXN
-8023URFHVV&RQWURO,QF
0\HUV5RDG
(DVW6\UDFXVH1<86$
3KRQH
)D[
(PDLO LQIRXV#MXPRQHW
,QWHUQHW ZZZMXPRXVDFRP
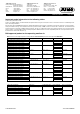
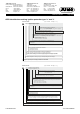
Failure rates and SFF for 701155...23 (AC 230 V)
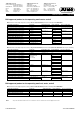
Failure rates and SFF for 701155...25 (AC/DC 24 V)
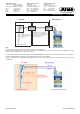
Note:
Variants 1 to 4 were evaluated with JUMO probes according to data sheets 901006 and 902006.
For variant 5, no sensor technology was included (only the JUMO safetyM STB/STW Ex).
In this case, the plant operator selects the sensor technology.
The PFH and PFD
avg
values were calculated with the assumption that the time to restore the system is 8 h (MTTR = 72 h). Furthermore, the calculation was based on
a lifetime of 10 years (T
1
= 10 y). The Common Cause Factor was determined according to the tables of DIN EN 61508 for sensor technology and logic.
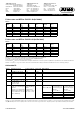
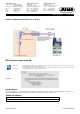
Achievable PL
Note:
Variants 1 to 4 were evaluated with JUMO probes according to data sheets 901006 and 902006. For variant 5, no sensor technology was included (only the JUMO
safetyM STB/STW). In this case, the plant operator selects the sensor technology. For this reason, the plant operator is responsible for evaluating the achieved PL.
Table 1:
Variant
λ
s
[FIT]
λ
dd
[FIT]
λ
du
[FIT]
SFF PFH (1/h)
PFD
avg
1 985.14 306.75 32.93 96 % 5.18 e
-9
2.29 e
-4
1a 985.14 306.75 32.93 96 % 1.66 e
-9
7.29 e
-5
2 988.1 303.79 32.93 96 % 1.66 e
-9
7.29 e
-5
3 1001.55 324.85 36.68 96 % 1.71 e
-9
7.46 e
-5
4 1007.61 341.89 38.58 96 % 1.73 e
-9
7.55 e
-5
5 1000.95 318.38 31.75 96 % 1.54 e
-9
6.74 e
-5
Table 2:
Variant
λ
s
[FIT]
λ
dd
[FIT]
λ
du
[FIT]
SFF
PFH (1/h)
PFD
avg
1 919.23 306.82 34.24 96 % 7.22 e
-9
3.19 e
-4
1a 919.23 306.82 34.24 96 % 3.71 e
-9
1.63 e
-4
2 886.19 303.86 34.24 96 % 3.71 e
-9
1.63 e
-4
3 947.18 325.86 37.89 96 % 3.75 e
-9
1.64 e
-4
4 953.24 350.21 40.59 96 % 3.85 e
-9
1.69 e
-4
5 938.89 323.57 36.89 96 % 3.68 e
-9
1.61 e
-4
Variant Connected sensors Sensor technolo-
gy architecture
Logic archi-
tecture
Achievable PL
1 1x Pt100 two-wire circuit 1oo1 1oo2D PLd
1a 2x Pt100/1000 two-wire cir-
cuit
1oo2 1oo2D PLe
2 2x Pt100/1000 three-wire cir-
cuit
1oo2 1oo2D PLe
3 2x thermocouple 1oo2 1oo2D PLe
4 1x Pt100/1000 two-wire and
three-wire circuit
1x thermocouple
1oo2 1oo2D PLe
5 STB/STW 701155 without
1oo2D sensor technology ar-
chitecture.
No probe or use of the input 4
to 20 mA (means that the sen-
sor is not taken into account
for the calculation).
Sensors connect-
ed by the plant op-
erator;
architecture ac-
cording to connec-
tion 1oo1 or 1oo2
1oo2D PL of the used sen-
sor
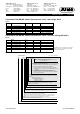
MTFF
d
= 100 years
Max. achievable PL of
the system with 1oo1
sensor technology ar-
chitecture
DC
701155
≥ 90 %
Max. achievable PL of
the system with 1oo2
sensor technology ar-
chitecture
DC
701155
≥ 90 %
PLb PLd PLe
PLc PLd PLe
PLd PLd PLe
PLe PLe PLe