
User Manual

For Your Safe Flight Page 9
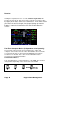
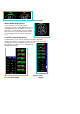
Horizontal mode Vertical mode
RPM and MAP Display Basics
In the vertical mode to the right and the
Horizontal mode above MAP (Manifold Pressure)
and RPM (Revolutions per Minute) are shown.
Operations exceeding red line cause the digital
value to turn red or yellow with the RAL coming
on and a digital value in the Scanner message
area.
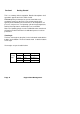
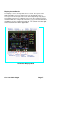
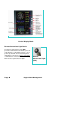
Linear Bar Graph Display Basics
The Bar Graphs section contains dedicated bar graphs with digital
display. An example is shown here. Pointers move horizontal left to right
showing value changes and digital readouts turn red
when primary exceedances occur. Non primary
functions flash white.
Horizontal mode Vertical mode