Pilot’s Guide Engine Data Management EDM-900 Primary TSO/STC Copyright 2011 J.P. Instruments, Inc. All Rights Reserved J.P. INSTRUMENTS INC. Information: P. O. Box 7033 Huntington Beach, CA 92646 Factory: 3185 B Airway Costa Mesa, CA 92626 (714) 557-5434 Fax (714) 557-9840 www.jpinstruments.com www.JPITech.com www.buyJPI.
Table of Contents Section-1 Getting Started View Angle Rotation Fuel Flow Computer Basics (independent of fuel quantity) Display Screen Basics Horizontal Display Mode Vertical Display Mode Remote Annunciate Light Basics RPM and MAP Display Basics Linear Bar Graph Display Basics Scanner® Information Area LeanFind Basics Section 2 - Interpreting Data Operation for each Phase of Flight Typical Normal Measurements Section 3 - Displays and Controls Control Buttons Scanner Displays Additional Displays Hobbs, Revi
Fuel Flow K factor Programming Trip Mode Setting the GPS Com Format Troubleshooting the EDM Diagnostic Testing on Startup and During Flight Diagnostic Messages Section 12 Appendices Shock Cooling (CLD) List of ALL messages in EDM-900 Navigation Data Formats Navigation Data Ports for GPS Comm Interface connections to selected GPS models Section 13 Technical Support For Your Safe Flight 43 45 45 47 47 47 48 48 49 50 50 50 51 Page 3
Section-1 Getting Started This is a summary of basic operation. Detailed descriptions of all operations appear later in this Pilot’s Guide. EDM-900 primary instrument has preset alarm limits and cautionary ranges per the POH (user cannot change them) typically for the following measurements of: oil temperature, oil pressure, fuel pressure, fuel quantity, cylinder head temperature, turbine inlet temperature, manifold pressure, and RPM.
List of abbreviations and acronyms Gauge Function Primary Message Area Alarm Abbreviation Primary Engine rotational speed RPM xxxx Engine Manifold Pressure MAP xx.x in hg Engine Cylinder Head Temp CHT2 xxx oF Engine Oil Temperature O-T xxx oF Engine Oil Pressure O-P xxx oF Fuel Pressure F-P xx PSI Fuel Flow to engine F-F xx.x GPH Comp. Discharge Temp. CDT xxx oF Turbine inlet Temp. Left side TIT-L xxxx oF Turbine Inlet Temp. Right side TIT-R xxxx oF Single Turbine Inlet Temp.
Rotation Holding the step button in for 5 seconds, with the engine OFF, will produce the gray arrow. This arrow can be rotated to a new up position by tapping the LF button and then the STEP button. If for some reason you chose the one bad angle (Landscape looking up from the buttons), return the instrument to JPI and JPI will rotate the screen. Fuel Flow Computer Basics (independent of fuel quantity) The fuel flow computer tracks the fuel flowing to the engine and computes various values based on this.
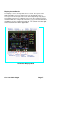
Display Screen Basics The display screen is arranged into three sections. The top left is the MAP and RPM section. The bottom left is the Scanner® section or message area. On the right side are the horizontal primary strip gauges. Non-Primary gauges have a digital read out only. The instrument ranges and alarm limits are configured to match those of your aircraft POH when the EDM is set up as a Primary instrument. TIT column is to the right of the last EGT/CHT when applicable.
Vertical Display Mode Remote Annunciate Light Basics The Remote Annunciator Light ‘RAL’ provides notification that an alarm is present in the display, for all Primary gauges. Upon power up, the RAL shows Red and yellow indicating it is functional. Before each flight, confirm that it is functional. Non-functioning RAL must be repaired before flight.
Horizontal mode Vertical mode RPM and MAP Display Basics In the vertical mode to the right and the Horizontal mode above MAP (Manifold Pressure) and RPM (Revolutions per Minute) are shown. Operations exceeding red line cause the digital value to turn red or yellow with the RAL coming on and a digital value in the Scanner message area. Linear Bar Graph Display Basics The Bar Graphs section contains dedicated bar graphs with digital display. An example is shown here.
Scanner® Information Area The Scanner® Information Area provides expanded information in the form of alpha-numeric messages, parameters and calculations. In Auto-Scan, parameters will ‘scan by’ once every 4 seconds (default). This rate can be changed in Pilot Programming Mode. Tap the STEP button for ‘Manual’ selection of any parameter. Parameters for the installed options will be displayed. To start the automatic scan tap LF and then STEP.
LeanFind Basics Simply pre-lean, tap the LF button (Lean Find) and begin leaning. The EDM will assist you in finding the first cylinder to peak. This example is for Rich of Peak, ROP. See page 24 for a more detailed description of leaning. Press LOP to exit the ROP mode and enter the LOP mode. 1. Establish cruise at approximately 65 to 75% power and pre-lean the mixture to 50°F estimated rich of peak EGT on any cylinder. 2. Wait about 30 seconds, then tap the LF button. 3.
Section 2 - Interpreting Data Operation for each Phase of Flight (Worth adding to your run-up checklist) Suggested setup: Engine Run-Up Set engine to run-up RPM Normalize view: Manual mode Verify: Uniform rise of about 50°F in all EGTs in single magneto operation. Uniform rise of EGTs with application of the mixture control.
After the engine is warmed up, use LeanFind to lean the mixture. Cruise Descent Suggested setup: Normalize view Automatic mode Be alert for: Uneven EGTs (injected engines). Make fine adjustments to throttle, then RPM, then mixture to level the display columns. Abnormal patterns of EGTs and CHT. (see Engine Diagnosis Chart on page 15). Suggested setup: Standard view Manual mode Be alert for: CLD: shock cooling alarm is set to -60°F.
Typical Normal Measurements The following chart lists typical normal measurement values that you will observe for most general aircraft engines. Your particular engine’s ranges may not fall within these values.
Engine Diagnosis Chart The following chart will help you diagnose engine problems in your aircraft. Display Symptom Probable Cause Recommende d Action TIT ~100° higher than EGTs This is normal 75° to 100° EGT rise for one cylinder during flight Spark plug not firing due to fouling, faulty plug, wire or distributor. Enrich mixture to return EGT to normal. Have plugs checked.
Symptom Display Probable Cause Recommended Action Slow rise in EGT. Low CHT Burned exhaust valve. CHT is low due to low power output. Have compression checked. High CHT on cylinders on one side of engine Obstruction under cowling. Check for improper installed baffling, cowl flap misalignment or bird nests. Rapid rise in CHT of one cylinder Detonation. Reduce power. Sudden off scale rise for any or all cylinders Pre-ignition Full rich and reduce power.
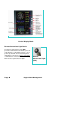
Section 3 - Displays and Controls The EDM monitors engine temperatures, pressures and voltages, assists in adjusting the fuel/air mixture, and helps diagnose engine malfunctions. There are multiple components of the user interface: Four front panel operating buttons below the bottom of the display.
In the LF mode holding the LF button after peak EGT is found will display the peak EGT. In Automatic or Manual modes holding the LF button for three seconds will toggle between Standard and Normalize (NRM) views. In the programming mode, tapping the PLUS or MINUS button will allow you to edit a parameter value. Holding LF during power up will display the primary alarm limits after the self-test is complete.
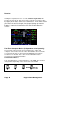
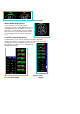
Scanner Displays Scanner EGT and CHT Analog Bar Graph The height of each column represents a EGT or CHT or TIT (if installed) temperature. Note: when in certain modes, such as leaning or normalize, the EGT resolution will temporarily be finer. Cylinder Numbers and Index Just below the bar graph columns are numbers identifying the respective cylinder. If TIT is installed, it is labeled by the letter T underneath. A square ‘Cylinder I.D.
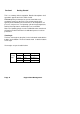
Linear Bar Graph Displays The linear bar graphs are arranged on the right half of the display. A typical layout is depicted here (Note: your actual configuration may vary). Typical functions that can be displayed are: Primary gauges Oil temperature Oil pressure Compressor Discharge temp Fuel Flow. Left tank fuel quantity Right tank fuel quantity Non Primary gauges Fuel pressure Volts Amps Fuel USED Estimated Fuel REM Estimated Time to Empty Estimated Outside Air Tem.
See ‘Section 9 - First Time Setup and Customization’. Note: Amps can operate either as a (Amps Charge) charge/discharge or (Amps Load) load meter, depending on programming. Remote Annunciate Light The remote auxiliary ‘ALERT LIGHT’ provides redundancy. Upon power up the Remote Annunciate Light displays Red and Yellow. If the RAL is not working abort the flight. While the EDM’s programmed configuration (aircraft make and model and primary status) is shown in the display.
or Programmed Limits in this Instrument. Dimming the Display Automatic dimming is provided to the panel display. You can manually adjust brightness by tapping the DIM button. You will see DIM BRT. Holding DIM lowers brightness or holding BRT increase brightness. The percentage of brightness is displayed in the message area. Section 4 - Operating Modes The EDM has four basic operating modes: Automatic, Manual, Program and LeanFind.
The order of automatic scan if the switch is in the ALL MODE: EGT/CHT, TIT, CLD, DIFF, CDT,OIL-T, REM, T to E, GPH, USD,AMP,Volts,OIL-P, and Fuel-P. Some non-primary measurements can be excluded from the Automatic mode: tap STEP to enter the Manual mode. Tap STEP repeatedly to index to the measurement you want to exclude. Then tap both the STEP and LF buttons simultaneously. Excluded measurements display a decimal point before the measurement name.
Fuel Remaining Fuel required to next GPS WP or Destination at present power Fuel Reserve at next GPS WP or Destination Nautical Miles per Gal Time to Empty Total Fuel Used Est. REM XX GAL WP REQ XX GAL Est. WP REM XX GAL ECON XX.X MPG Est. T to E XX:XX H:M USD X.X GAL In gallons, liters, pounds or kilograms Present with GPS interface, valid signal and way point Present with GPS interface, valid signal and way point Present with GPS interface and valid signal.
EGT °F below peak The following depicts the power, mixture and temperature relationships. Best Best power economy range range First cylinder to peak. Use Rich of Peak leaning Last cylinder to peak.
Rich of Peak leaning is as simple as: A. B. C. D. R Pre-lean your mixture. Tap the LF button (verify ROP appears). Lean mixture until LEANEST flashes (peak found). Enrichen to the desired value ‘Rich Of Peak’. Procedure Scanner Example Comments 1 Establish cruise at 65 to 75% power. 2 Pre-lean the mixture to 50°F estimated rich of peak on any EGT: _________°F. 1490 370 EGT CHT 3 Wait one minute 4 Tap the LF button ROP 5 Lean the mixture at EGT approx. 10°/second without pausing.
Lean of Peak leaning is as simple as: A. B. C. D. L Pre-lean your mixture. Tap the LF button (verify LOP appears). Lean mixture until RICHEST flashes (peak found). Enrichen to the desired value ‘Lean Of Peak’. Procedure Scanner Example Comments 1 Establish cruise at 65 to 75% power. 2 Pre-lean the mixture to 3 4 50°F estimated rich of peak on any EGT: _________°F. Wait one minute Tap the LF button 5 Lean the mixture at approx. 10°/second without pausing. (cylinder I.D.
LeanFind Procedure—General Explanation Lycoming and Continental established specific restrictions on leaning that must be followed, such as percent power, climb leaning, and TIT limits. Lycoming recommends operation at peak of EGT at 75% or less power only. Continental recommends operation at peak EGT at 65% or less power only. This guide does not supersede specific recommendations of the engine or airframe manufacturer. It is your responsibility to know your aircraft’s limitations.
Column of Leanest cylinder flashes indicating the first EGT to peak. Fuel Flow will go down then up as one enriches mixture You are leaning to Rich of Peak If you want to lean Lean of Peak press button. Leaning Rich Of Peak (ROP) Detection: Eventually, one cylinder will reach peak before any of the other cylinders. The EDM will determine this automatically. The EDM will indicate success in finding a peak by displaying the word LEANEST for two seconds and flashing its corresponding Cylinder column.
Leaning Lean Of Peak (LOP) Detection: Note: This mode should only be used when your engine is equipped with balanced fuel injectors or you have a DIF value of around 80 degrees. When using the Lean of Peak mode, you lean until all EGTs decrease slightly below their respective peaks. The EDM has automatic peak detection and will sequentially indicate leaning progress. When the first EGT peaks, the word LEANEST appears and the cylinder I.D. box highlights the cylinder number.
Expanded Leaning Procedures Lean Of Peak, LOP mode: During the ‘lean of peak’ process, the EDM hunts for the last cylinder to peak. Ultimately, you want to have ALL cylinders operating on the lean side of peak. You will final adjust your mixture to this cylinder. To provide a unique graphical depiction during lean of peak operation, the columns become inverted after the first EGT goes just beyond peak. Each EGT column then originates from the top of the display and drops downward.
Common Misapplications Some of the more common misapplications made by first-time EDM users are presented here in an attempt to help you avoid similar problems. Problem LeanFind finds a ‘peak’ too soon. Situation Failure to pre-lean before performing LeanFind or you stopped leaning. Leaning too slowly. Corrective action Follow the pre-lean procedure in ‘Error! Reference source not found.’ section (pg 24). Lean more quickly. Lean at the speed of approximately 10°F per second.
Section 6 - Fuel Flow Operation Fuel Management Without a means of measuring accurate fuel flow, you must rely on the aircraft fuel gauges or total time of flight. Aircraft fuel gauges are notoriously inaccurate (they are only required by the FAA to read accurately when displaying empty). Determining fuel consumption by multiplying time of flight by estimated flow rate is, at best, an approximation, and assumes a constant fuel flow rate for each phase of flight.
Start Up Fuel On power-up, you will be prompted to enter any fuel you might have added to the aircraft (this process updates the REM and USD values). The EDM will flash REFUEL? . If you didn’t add any fuel, simply tap NO to quit, otherwise tap YES to pick one of the three quickset choices below: If you say YES then you will see Fuel onboard, if you have Aux tanks you will see TWO chooses like in the example 76 GAL Main and Main + Aux = 96GAL. You pick the one you want to enter.
Resetting ‘USD’ USD is automatically reset whenever you perform REFUEL on your EDM (except if TRIP mode = yes). After filling your tanks and prior to engine start you should inform the EDM that the aircraft has been filled. In this case USD is automatically set to zero. To manually zero the amount of fuel USD at any time, manually STEP to display USD and then hold both DIM (button 3) and EGT/FF (button 4) until the display shows ‘USD 0.0 GAL ’ (this normally takes about five seconds).
Section 7 - Alarms Whenever a primary measured parameter falls outside of the normal allowed operating limits, i.e. goes beyond redline, the main display will blink an alert icon. This consists of the current digital value and a flashing red label in the Scanner area and the REDRemote Annunciate Light. For example, if CHT 2 is at 480, and redline is 460, the o alert would be displayed as CHT2 480 F.
Section 8 - Memory and Data Download The EDM compresses and records all displayed parameters once every six seconds (default) in Long Term Data Memory (note: you can change this rate to be 1 to 500 seconds). This data is retrievable by inserting a USB Drive into the jack on the front of the instrument and following the prompts. You can choose to retrieve ‘ALL’ the data stored in the EDM, or only the ‘NEW’ data recorded since your last retrieval. In either case, the selected data in the EDM is not erased.
Transferring data from the USB Flash Drive to a PC To transfer your data from the USB flash drive to your PC, follow these easy steps. 1. On your PC, start the EzTrends program. 2. Plug in the USB flash drive into an available USB port. 3. In EzTrends, select the Move and Plot Data from Memory Stick option. 4. In the displayed list, find the USB flash drive and double click it. 5. Select the file you wish to plot and then select the flight in that file.
Pilot Programming Mode To start Pilot Program Mode, hold both STEP and LF buttons until you see PROGRAM for two seconds. Then tap the NEXT button to advance to the desired item in the list. Hold the NEXT button to back up in the list. Either tap NEXT until you see END. Yes and then tap EXIT or hold both NEXT and LF to save changes. First button advances to NEXT item Second button selects values Program Mode Refuel? Stays on for two seconds. Tap REFUEL to change fuel status. Exits program mode when done.
Engine HP = 225 Map Adjustment +0.0 K-Factor 1 29.90 GPS Format = 6 Set the nominal horsepower of your engine. This value will is used with FF to calculate LOP %HP. Hold NEXT and button 2 for 5 seconds until you see ADJUST. Use PLUS or MINUS to adjust. Tap SAVE to save changes. Tap NEXT to skip to next item. -3.0 +3.0 Correct the MAP to the altimeter setting at a sea level airport ±3.0 inHg. Hold NEXT and button 2 for 5 seconds until you see ADJUST. Use PLUS or MINUS to adjust.
Section 10 - Adjusting Manifold Pressure & %HP Adjusting the HP Constant for Rich of Peak Operation To fine tune the %HP readout, follow this procedure airborne between 5,000 and 8,000 feet MSL. (note: Verify that the MAP adjustment has been perform prior to this process). 1. Enter the pilot program mode by simultaneously holding the STEP and LF buttons for five seconds. 2. Tap STEP repeatedly until you see HP Constants. Hold both NEXT and Button 2 until you see ROP and LOP appear in status bar. Tap ROP.
Adjusting the HP Value You must set the nominal horsepower of your engine. This value is used to calculate the percent horsepower display. 1. Enter the pilot program mode by simultaneously holding the STEP and LF buttons for five seconds. 2. Tap NEXT repeatedly until you see Engine HP 200. Then hold both the NEXT and Button 2 until you see ADJUST momentarily. 3. Adjust the value PLUS or MINUS to equal your engines HP. 4. Hold both NEXT and Button 2 until you see SET.
Fuel Flow K factor The K factor is shown on the fuel flow transducer as a hand written fourdigit number, which represents the number of pulses per tenth gallon of fuel flow. Before installing the transducer, record its K factor here _________. The EDM stores the K Factor in the form 29.12, i.e. if the transducer K factor is 2912, you would enter 29.12 in the EDM’s K factor field.
Date fuel used fuel used K factor factor = x/ initials Setting the K factor This procedure differs somewhat from setting other parameters. If you haven’t already done so, start the pilot programming procedure by simultaneously holding the STEP and LF buttons for a few seconds until you see the word PROGRAM appear. 1. Tap STEP button to advance to the KF-SET screen KF=29.90 . 2.
Programming Trip Mode Trip Mode keeps a running total of fuel used (USD) for all flights. If Trip Mode = No, fuel ‘USD’ is zeroed after updating the EDM’s fuel computer via Refuel modes. NOTE: to clear the fuel used display at any time, tap STEP until you see USD. Hold both DIM and ALL/EGT/FF buttons until the display shows ‘.0 USD’. 1. Enter the pilot program mode by simultaneously holding the STEP and LF buttons for five seconds. 2. Tap NEXT repeatedly until you see TRIP Used? No . 3.
Factory Limits (Hold Step and LF at end of Pilot Program Mode). Factory Next MAIN = 76 Plus Minus Aux = 0.0 Plus Minus AMPS ADJ.
Troubleshooting the EDM Diagnostic Testing on Startup and During Flight When your EDM is first turned on, it tests internal components, calibration and integrity of the probes. Most alarms are disabled until the engine has been started. During flight, probes are constantly checked for inconsistent or intermittent signals. A faulty channel or probe encountered during start-up or during flight will be deleted from the sequence, producing a missing column or blank digital data.
HOBSERR HOBSBAD HANGCFG, HANGCAL The time of the most recent flight may not be reflected in the HOBBS meter. The HOBBS data has been corrupted. The HOBBS meter will be cleared. Internal system errors. Return unit to factory. GPS Interface Diagnostics Measurements ‘xxx REQ’, ‘xxx RES’ and ‘xxx MPG’ are all missing from the scan. NO - COM message and ‘xxx REQ’, ‘xxx RES’ and ‘xxx MPG’ are all missing from the scan.
List of ALL messages in EDM-900 Startup Banner Messages ===================== EDM900 PRIMARY FOR 182P-SA000152WI 550 Refuel Messages ===================== REFUEL? TOP OFF? MAIN 74.0 GAL CHANGE FUEL QTY? + X.X GAL Adjusted by + 0.5 GAL Initial Fuel 71.6 GAL LeanFind Messages (ROP) ===================== ROP EGT 1494 FF 17.7 NOPEAK EGT 1494 FF 17.7 LEANEST ROP -90 FF 12.5 LeanFind Messages (LOP) ==================== ROP EGT 1494 FF 17.7 NOPEAK LOP EGT 1494 FF 17.7 LEANEST RICHEST LOP -55 FF 11.
Navigation Data Formats Output of GPS; input to EDM. The EDM automatically configures itself for one of three industry standard data formats: Format Baud NMEA-183 (Marine Nav Data Format) 4,800 This is the format for most handheld GPS receivers. Loran must have sentences RMA & RMB. GPS must have sentences RMB & RMC. Aviation Data Format 9,600 “Output sentence type 1” Required sentences are: A, B, C, D, E, I and L first character identifier byte.
Section 13 - Technical Support JPI offers both e-mail and telephone technical support. Have your model and serial number ready when you call. Call JPI for a return authorization number (RMA) before returning any equipment. J.P.INSTRUMENTS Inc. 3185 B Airway Costa Mesa, CA 92626 Call: (800) 345-4574 Web: www.jpinstruments.com or www.JPITech.com Limited Warranty J.P. Instruments Inc. (JPI) warrants all parts in your new EDM to be free from defects in material and workmanship under normal use.
EDM Quick Reference Guide * * Pre-leaning procedure:, 28 A Accumulate, 45 total, 35 Adjusting K-factor, 42 Alarm limits, 9, 36 display, 18 Alarms, 36 Alerts, 36 Allied Signal, 45 Automatic mode, 22 Aviation data format, 50 B Bar graph, 9, 20 Baud rate, 50 Blinking display, 26, 27, 31 Button DIM, 18 LF, 17 RoP/LoP, 17 Buttons front panel, 6, 17 C Calibration horsepower, 41, 42 internal self test, 47 K factor, 43 K-factor, 42 MAP, 41 OAT, 39 Carburetor ice, 15 temperature, 23 Celsius display indicator, 19
F Fahrenheit display indicator, 19 OAT, 39 Failure to pre-lean, 32 FF, select switch, 35 First cylinder to peak, 28 First time setup, 38 Flashing display, 26, 27, 31 Flat EGT response, 15, 16 Fuel accumulate, 35 injectors, 16 injectors, clogged, 12, 15 Octane, 16 pump, 16 remaining, 24 required, 24 reserve, 24 start up, 6, 34 used, 24 Fuel flow, 33 diagnostics messages, 47 Full throttle, 12 G GAMI, 24, 31 Gasket, manifold, 16 Getting started, 4 GPS data formats, 50 data ports, 50 interface diagnostics, 48
EDM Quick Reference Guide best power, 25 MPG, MPK, MPL, MPP, 24 N Nautical miles per gallon, 24 Navigation data formats, 50 NMEA-183, 50 NO COM, 48 NO SIG, 48 NO WPT, 48 Normal engine limits, 14 Normalize view, 19 Northstar binary format, 50 NRM, 19 Red line, 14 REM, 24 Remove measurements, 23 REQ, 24 RES, 24 Resolution, EGT display, 39 Rich of Peak, 24 RoP/LoP button, 17 Rough engine, 15 RPM display, 9 RS-232, 50 Run-up, 12 S O OAT calibration, 39 F or C, 39 Octane, 16 Off-scale EGT bars, 32 OPEN PRB, 4
GPS, 48 Trouibleshooting fuel flow, 47 Turbocharged Engines, 31 U lifter, 15 stuck, 15 Vapor, 16 View change diagram, 18 normalize, Standard, 19 Uniform, CHT, EGT not, 15 USD, 24 W Warranty, 51 V Valve