
Datasheet


IXYS Reserves the Right to Change Limits, Test Conditions, and Dimensions.
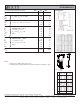
IXYK120N120C3
IXYX120N120C3
IXYS REF: IXY_120N120C3(9P-C91) 9-09-13
Fig. 19. Inductive Turn-on Switching Times vs.
Collector Current
20
30
40
50
60
70
80
90
50 55 60 65 70 75 80 85 90 95 100
I
C
- Amperes
t
r i
- Nanoseconds
30
31
32
33
34
35
36
37
t
d(on)
- Nanoseconds
t
r i
t
d(on)
- - - -
R
G
= 1
, V
GE
= 15V
V
CE
= 600V
T
J
= 25ºC
T
J
= 150ºC
Fig. 20. Inductive Turn-on Switching Times vs.
Junction Temperature
0
20
40
60
80
100
120
25 50 75 100 125 150
T
J
- Degrees Centigrade
t
r i
- Nanoseconds
28
30
32
34
36
38
40
t
d(on)
- Nanoseconds
t
r i
t
d(on)
- - - -
R
G
= 1
, V
GE
= 15V
V
CE
= 600V
I
C
= 100A
I
C
= 50A
Fig. 18. Inductive Turn-on Switching Times vs.
Gate Resistance
0
20
40
60
80
100
120
140
160
12345678910
R
G
- Ohms
t
r i
- Nanoseconds
20
28
36
44
52
60
68
76
84
t
d(on)
- Nanoseconds
t
r i
t
d(on)
- - - -
T
J
= 150ºC, V
GE
= 15V
V
CE
= 600V
I
C
= 50A
I
C
= 100A
Fig. 21. Maximum Peak Load Current vs. Frequency
0
10
20
30
40
50
60
70
80
90
100
110
120
10 100 1,000
f
max
- KiloHertzs
I
C
- Amperes
T
J
= 150ºC
T
C
= 75ºC
V
CE
= 600V
V
GE
= 15V
R
G
= 1
D = 0.5
Square Wave
Triangular Wave