
Users Manual Part 4

Clinical User’s Guide
IBA | 33-13|
Volume 1 - Treatment Session
|Part VI
- Using adaPT
deliver
in Standalone Mode Including One or More Beams into a Session
|
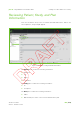
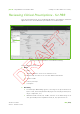
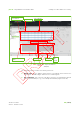
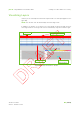
Visualizing Layers
Click any of the listed layers and a visual representation of that layer appears in the
spot map.
Note: You can also click the desired layer from the range scale.
In addition, the position of the layer in the entire beam is represented by the thick
vertical green bar in the range scale. The most distal layer is positioned at the right.
Figure 33-6. Layer Information - details
layer
representation
layer ranking in beam
range scale
selected layer