
Users Manual Part 4

IBA | 33-12 |
Clinical User’s Guide
Volume 1 - Treatment Session
|Part VI
- Using adaPT
deliver
in Standalone Mode Including One or More Beams into a Session
|
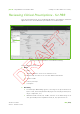
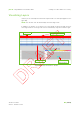
For each layer, the following information is listed:
Range (g/cm
2
)
1
Dose (MU): in addition to the value of the dose, a graphic representation is
also given in the form of a colored bar.
Time (s)
Spot Size X (FWHM) (cm): this is a parameter that defines the width of the
Gaussian distribution of the beam along the X-axis, at Full Width at Half
Maximum.
Spot Size Y (FWHM) (cm): this is a parameter that defines the width of the
Gaussian distribution of the beam along the Y-axis, at Full Width at Half
Maximum.
Note: The Spot Size X and Spot Size Y fields remain empty if the TPS does
not communicate the correct values.
Field Size X (cm)
Field Size Y(cm)
Number of paintings: for detailed information, refer to Chapter 22 “PBS
Multiple Repainting”.
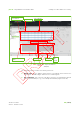
Layer palette: a visual representation of all layers, in sequential order. Each layer
is identified by its sequence number; the layer also displays a miniature version
of the spot map.
The sequence number of the current layer is enlarged (layer 6 in Figure 33-5).
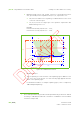
Energy/Layer graph: this graph illustrates the energy of the particles of each
layer.
The sequence number of the current layer is represented by a white square
(layer 6 in Figure 33-5).
Spot map: a visual representation of the selected layer, along with the dose and
the spot map legend.
Note: The Spot Size, Field Size, and spot map axes are expressed in the IEC
coordinate system.
To select a layer you either click it on the range scale or on the list of layers. The
selected layer appears on a dark green line.
If desired, you can modify the column width in the list of layers. To do so, position
the cursor on the border between adjacent columns and drag the border as desired.
1. The Distal range and Proximal range values are defined according to ICRU49
(International Commission on Radiation Units and Measurements - Report 49).