
Users Manual Part 3

IBA | 29-10 |
Clinical User’s Guide
Volume 1 - Treatment Session
|Part IV
- Using
ada
PT
prescribe
Managing Beams
|
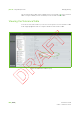
Dose (MU): in addition to the value of the dose, a graphic representation is
also given in the form of a colored bar.
Time (s)
Spot Size X (FWHM) (cm): this is a parameter that defines the width of the
Gaussian distribution of the beam along the X-axis, at Full Width at Half
Maximum.
Spot Size Y (FWHM) (cm): this is a parameter that defines the width of the
Gaussian distribution of the beam along the Y-axis, at Full Width at Half
Maximum.
Note: The Spot Size X and Spot Size Y fields remain empty if the TPS does
not communicate the correct values.
Field Size X (cm)
Field Size Y (cm)
Number of paintings: for detailed information, refer to section “Repainting
Modes” on page 20-5.
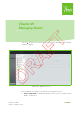
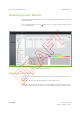
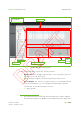
Layer palette: a visual representation of all layers, in sequential order. Each layer
is identified by its sequence number; the layer also displays a miniature version
of the spot map.
The sequence number of the current layer is enlarged (layer 2 in Figure 29-6).
Energy/Layer graph: this graph illustrates the energy of the particles of each
layer.
The sequence number of the current layer is represented by a white square
(layer 2 in Figure 29-6).
Spot map: a visual representation of the selected layer, along with the dose and
the spot map legend.
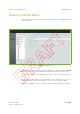
Some characteristics of the layer list panel:
You can modify the width of the columns in the panel, if desired.
If a column is not wide enough to display all data, four dots appear to indicate
that more precise data is available. Extend the width of the column to view the
complete data.