
Users Manual Part 2

IBA | 22-4 |
Clinical User’s Guide
Volume 1 - Treatment Session
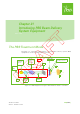
|Part III
- The Pencil Beam Scanning (PBS) Suite PBS Multiple Repainting
|
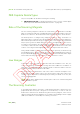
Graph
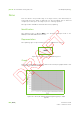
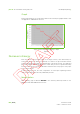
Figure 22-4 illustrates the energy that is delivered in each layer. A graph similar to this
one appears on adaPTdeliver screens.
Figure 22-4. In-Layers Energy/Layer Graph
(typical)
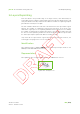
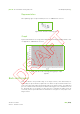
Decrease in Energy
From the distal to the proximal edge of the target volume, each defined layer is
scanned by the proton beam (or painted) once. When the proton beam finishes
scanning the layer that ends at the proximal edge of the target volume, the repainting
process restarts at the distal edge of the tumor. This process is repeated as many
times as necessary until the prescribed dose is delivered for every spot in every layer
of the target volume.
In this re-painting mode, the dose computation for each layer re-painting and the
order of delivery by layers are fully handled by the TPS.
Identification
This repainting type is labelled PBS-DE in the (Delivery) Technique fields on the
adaPTprescribe and adaPTdeliver screens.