
ITP700 Debug Port Design Guide

R
ITP700 Debug Port Design Guide 23
2 Multiprocessor ITP Debug Port
Implementation Guidelines
The ITP scan chain of multiprocessor systems with multiple chipset components requires that the
debug port and associated scan chain be designed into the system board. An interposer debug port
solution will not provide visibility to a multiple load scan chain because an interposer has no
physical way to break the scan chain without losing access to the remainder of the processors and
chipset. If the traces, termination, and connector footprint (without the header) for the debug port
are designed into a system board, it is possible to enable use of a multiple load scan chain by
simply populating the debug port header.
The signals involved in the ITP debug system are high-speed signals and must be routed with high
speed design considerations in mind. The implementation offers some flexibility in areas such as
scan chain routing, addition of non-ITP TAP master to the local scan chain, and clock rate of the
scan chain. However, the implementation is not flexible in system bus BPM[5:0]# , RESET#, or
BCLK(p/n) connections.
Simulation models of the ITP interface hardware are available. Intel highly recommends that
customers include this model in platform simulations. These models can be found in Appendix E
of this document.
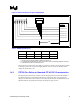
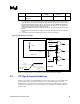
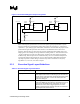
2.1 General Description
The debug port (DP) is the command and control interface for the In-Target Probe (ITP) debug
tool. The ITP is a specialized Test Access Port (TAP) master that interfaces into processors and
chipset TAP agents through a carefully routed private scan chain on the target system.
The primary operations of the ITP and associated debug port are to provide system, execution, and
TAP interfaces to the target system. The system interface informs the debug tool if power, clock,
and access state are available in the target system. The execution interface is used to coordinate
debug activities with the current execution state of the agents attached to the debug port. The TAP
interface allows for query and editing of registers and state within the agents attached to the scan
chain.
The debug port and JTAG signal chain must be designed into a system board to utilize the ITP for
debug purposes. There are several mechanical, electrical and functional constraints on the debug
port and associated scan chain that must be followed. The mechanical constraints require a debug
port connector to be installed in the system with adequate physical clearance for the ITP hardware
while the system is running. The electrical constraints require that the debug port operate using the
TAP signals at high speed, and that the ITP be connected to the processor system bus debug
signals for recovery at full speed through a dedicated BCLK connection. The functional constraint
requires the debug port to be able to share the scan chain with any local TAP systems via a
handshake and multiplexing scheme.