
Intel Xeon Processor 2.80 GHz Thermal/Mechanical Design Guidelines

Dual-Core Intel
®
Xeon
®
Processor 2.80 GHz Thermal/Mechanical Design Guidelines 17
Thermal/Mechanical Reference Design
Dual-Core Intel Xeon processor 2.80 GHz, the T
CONTROL
value is obtained by reading a processor
model specific register (MSR) and adding this offset value to a base value. The equation for
calculating T
CONTROL
is:
Equation 2-2. T
CONTROL
= T
CONTROL_BASE
+ Offset
Where:
T
CONTROL_BASE
= A fixed base value defined for a given processor generation as published
in the processor datasheet.
Offset = A value programmed into each processor during manufacturing that can
be obtained by reading the IA32_TEMPERATURE_TARGET MSR.
This is a static and a unique value. Refer to the Prescott, Nocona and
Potomac Processor BIOS Writer’s Guide for further details.
The T
CONTROL_BASE
value for the Dual-Core Intel Xeon processor 2.80 GHz is 50°C. The Offset
value, which depends on several factors (i.e. leakage current), can be any number between 0 and
(T
CASE
MAX - T
CONTROL_BASE
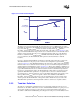
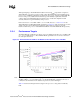
). Figure 2-3 depicts the interaction between the Thermal Profile
and T
CONTROL
for an Offset value that is greater than 0 (i.e. T
CONTROL
greater than
T
CONTROL_BASE
).
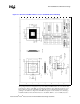
Since T
CONTROL
is a processor diode temperature value, an equivalent T
CASE
temperature must be
determined to plot the T
CASE
MAX @ T
CONTROL
point on the Thermal Profile graph. Location 1
on the Thermal Profile represents a T
CASE
value corresponding to an Offset of 0 (the theoretical
minimum for the given processor family). Any Offset value greater than 0 moves the point where
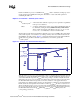
the Thermal Profile must be met upwards, as shown by location 2 on the graph. If the diode
temperature is less than T
CONTROL
, then the case temperature is permitted to exceed the Thermal
Profile, but the diode temperature must remain at or below T
CONTROL
. In other words, there is no
T
CASE
specification for the processor at power levels less than Pcontrol. The thermal solution for
the processor must be able to keep the processor’s T
CASE
at or below the T
CASE
values defined by
the Thermal Profile between the T
CASE
MAX @T
CONTROL
and T
CASE
MAX points at the
corresponding power levels.
Figure 2-3. T
CONTROL
and Thermal Profile Interaction
Pcontrol_base
TDP
T
CASE
T
CASE
MAX
T
CASE
@
Pcontrol_base
Power
Thermal Profile
T
CASE
@ T
CONTROL
Pcontrol
1
2
Pcontrol_base
TDP
T
CASE
T
CASE
MAX
T
CASE
@
Pcontrol_base
Power
Thermal Profile
T
CASE
@ T
CONTROL
Pcontrol
1
2
T
CASE
MAX @
T
CONTROL
T
CASE
MAX @
Pcontrol_base
T
CASE
MAX
Pcontrol_base
TDP
T
CASE
T
CASE
MAX
T
CASE
@
Pcontrol_base
Power
Thermal Profile
T
CASE
@ T
CONTROL
Pcontrol
1
2
Pcontrol_base
TDP
T
CASE
T
CASE
MAX
T
CASE
@
Pcontrol_base
Power
Thermal Profile
T
CASE
@ T
CONTROL
Pcontrol
1
2
T
CASE
MAX @
T
CONTROL
T
CASE
MAX @
Pcontrol_base
T
CASE
MAX