
Intel RAID Controller SRCSASRB 1800 Mailbox Compatibility Report
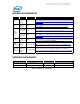

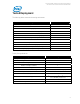
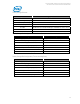
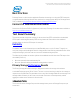
Table Of Contents
- Microsoft Exchange Server Jetstress
- 3/5/2009 7:41:26 PM -- Jetstress testing begins ...3/5/2009 7:41:26 PM -- Prepare testing begins ...3/5/2009 7:41:32 PM -- Attaching databases ...3/5/2009 7:41:32 PM -- Prepare testing ends.3/5/2009 7:41:32 PM -- Dispatching transactions begins ...3/5/2009 7:41:32 PM -- Database cache settings: (minimum: 128.0 MB, maximum: 1.0 GB)3/5/2009 7:41:32 PM -- Database flush thresholds: (start: 10.2 MB, stop: 20.5 MB)3/5/2009 7:41:37 PM -- Database read latency thresholds: (average: 0.02 seconds/read, maximum: 0.1 seconds/read).3/5/2009 7:41:37 PM -- Log write latency thresholds: (average: 0.01 seconds/write, maximum: 0.1 seconds/write).3/5/2009 7:41:39 PM -- Operation mix: Sessions 12, Inserts 25%, Deletes 10%, Replaces 50%, Reads 15%, Lazy Commits 80%.3/5/2009 7:41:39 PM -- Performance logging begins (interval: 15000 ms).3/5/2009 7:41:39 PM -- Attaining prerequisites: 3/5/2009 7:47:42 PM -- \Database (JetstressWin)\Database Cache Size, Last: 967401500.0 (lower bound: 966367600.0, upper bound: none)3/6/2009 7:47:44 PM -- Performance logging ends.3/6/2009 7:47:44 PM -- JetInterop batch transaction stats: 569497, 569587, 570316, and 570129.3/6/2009 7:48:47 PM -- Dispatching transactions ends.3/6/2009 7:48:47 PM -- Shutting down databases ...3/6/2009 9:24:10 PM -- Instance2840.1 (complete), Instance2840.2 (complete), Instance2840.3 (complete), and Instance2840.4 (complete)3/6/2009 9:24:11 PM -- Performance logging begins (interval: 30000 ms).3/6/2009 9:24:11 PM -- Verifying database checksums ...3/6/2009 10:10:32 PM -- M: (100% processed), N: (100% processed), O: (100% processed), and P: (100% processed)3/6/2009 10:10:33 PM -- Performance logging ends.3/6/2009 10:10:33 PM -- C:\Data\Jetstress\DBChecksum_2009_3_6_21_24_10.blg has 92 samples.3/6/2009 10:10:37 PM -- C:\Data\Jetstress\DBChecksum_2009_3_6_21_24_10.html is saved.3/6/2009 10:10:37 PM -- Verifying log checksums ...3/6/2009 10:10:41 PM -- L:\01 (8 logs passed), L:\02 (22 logs passed), L:\03 (22 logs passed), and L:\04 (21 logs passed)3/6/2009 10:10:41 PM -- C:\Data\Jetstress\Stress_2009_3_5_19_41_37.blg has 5784 samples.3/6/2009 10:10:41 PM -- Creating test report ...3/6/2009 10:11:47 PM -- Volume M: has 0.0158 for Avg. Disk sec/Read.3/6/2009 10:11:47 PM -- Volume N: has 0.0165 for Avg. Disk sec/Read.3/6/2009 10:11:47 PM -- Volume O: has 0.0151 for Avg. Disk sec/Read.3/6/2009 10:11:47 PM -- Volume P: has 0.0173 for Avg. Disk sec/Read.3/6/2009 10:11:47 PM -- Volume L: has 0.0045 for Avg. Disk sec/Write.3/6/2009 10:11:47 PM -- Volume L: has 0.0000 for Avg. Disk sec/Read.3/6/2009 10:11:47 PM -- Test has 4.86722147380135 Maximum Database Page Fault Stalls/sec.3/6/2009 10:11:47 PM -- Test has 0 Database Page Fault Stalls/sec samples higher than 0.3/6/2009 10:11:47 PM -- C:\Data\Jetstress\Stress_2009_3_5_19_41_37.xml has 5759 samples queried.
- Microsoft Exchange Server Jetstress
- Microsoft Exchange Server Jetstress
- 3/5/2009 8:47:51 AM -- Jetstress testing begins ...3/5/2009 8:47:51 AM -- Prepare testing begins ...3/5/2009 8:47:58 AM -- Attaching databases ...3/5/2009 8:47:58 AM -- Prepare testing ends.3/5/2009 8:47:58 AM -- Dispatching transactions begins ...3/5/2009 8:47:58 AM -- Database cache settings: (minimum: 128.0 MB, maximum: 1.0 GB)3/5/2009 8:47:58 AM -- Database flush thresholds: (start: 10.2 MB, stop: 20.5 MB)3/5/2009 8:48:03 AM -- Database read latency thresholds: (average: 0.02 seconds/read, maximum: 0.05 seconds/read).3/5/2009 8:48:03 AM -- Log write latency thresholds: (average: 0.01 seconds/write, maximum: 0.05 seconds/write).3/5/2009 8:48:05 AM -- Operation mix: Sessions 12, Inserts 25%, Deletes 10%, Replaces 50%, Reads 15%, Lazy Commits 80%.3/5/2009 8:48:05 AM -- Performance logging begins (interval: 15000 ms).3/5/2009 8:48:05 AM -- Attaining prerequisites:3/5/2009 8:54:13 AM -- \Database(JetstressWin)\Database Cache Size, Last: 968089600.0 (lower bound: 966367600.0, upper bound: none)3/5/2009 10:54:15 AM -- Performance logging ends.3/5/2009 10:54:15 AM -- JetInterop batch transaction stats: 57614, 56979, 57398, and 57460.3/5/2009 10:54:16 AM -- Dispatching transactions ends.3/5/2009 10:54:16 AM -- Shutting down databases ...3/5/2009 10:54:35 AM -- Instance2304.1 (complete), Instance2304.2 (complete), Instance2304.3 (complete), and Instance2304.4 (complete)3/5/2009 10:54:35 AM -- Performance logging begins (interval: 15000 ms).3/5/2009 10:54:35 AM -- Verifying database checksums ...3/5/2009 11:33:36 AM -- M: (100% processed), N: (100% processed), O: (100% processed), and P: (100% processed)3/5/2009 11:33:37 AM -- Performance logging ends.3/5/2009 11:33:37 AM -- C:\Data\Jetstress\DBChecksum_2009_3_5_10_54_35.blg has 156 samples.3/5/2009 11:33:43 AM -- C:\Data\Jetstress\DBChecksum_2009_3_5_10_54_35.html is saved.3/5/2009 11:33:43 AM -- Verifying log checksums ...3/5/2009 11:33:48 AM -- L:\01 (22 logs passed), L:\02 (22 logs passed), L:\03 (22 logs passed), and L:\04 (22 logs passed)3/5/2009 11:33:48 AM -- C:\Data\Jetstress\Performance_2009_3_5_8_48_3.blg has 504 samples.3/5/2009 11:33:48 AM -- Creating test report ...3/5/2009 11:33:54 AM -- Volume M: has 0.0161 for Avg. Disk sec/Read.3/5/2009 11:33:54 AM -- Volume N: has 0.0167 for Avg. Disk sec/Read.3/5/2009 11:33:54 AM -- Volume O: has 0.0153 for Avg. Disk sec/Read.3/5/2009 11:33:54 AM -- Volume P: has 0.0173 for Avg. Disk sec/Read.3/5/2009 11:33:54 AM -- Volume L: has 0.0051 for Avg. Disk sec/Write.3/5/2009 11:33:54 AM -- Volume L: has 0.0000 for Avg. Disk sec/Read.3/5/2009 11:33:54 AM -- Test has 0 Maximum Database Page Fault Stalls/sec.3/5/2009 11:33:54 AM -- Test has 0 Database Page Fault Stalls/sec samples higher than 0.3/5/2009 11:33:54 AM -- C:\Data\Jetstress\Performance_2009_3_5_8_48_3.xml has 479 samples queried.Microsoft Exchange Server Jetstress

Intel® 1800 Mailbox Exchange Server 2007 Storage Solution
Intel
®
Server Chassis SC5400 and Server Board S5000PSL
9
Best Practices
Exchange Server is a disk-intensive application. Based on the testing runs using the ESRP framework,
we recommend the following Microsoft best practices for storage system design for Exchange Server
2007, available at: http://technet.microsoft.com/en-us/l
ibrary/bb124518.aspx.
Contact for Additional Information
Consult the Certified Intel RAID Configurations for Microsoft Exchange Servers document available at:
http://www.intelraid.com/tech.php
.
Test Result Summary
This section provides a high level summary of the test data from ESRP and the link to the detailed
HTML reports which are generated by ESRP testing framework. Please click on the underlined
headings below to view the HTML report for each test.
Reliability
A number of tests in the framework are to check Reliability tests runs for 24 hours. The goal is to
verify the storage can handle high I/O load for a long period of time. Both log and database files will be
analyzed for integrity after the stress test to ensure no database/log corruption.
The following list provides an overview: (click on the underlined word will show the HTML report after
the reliability tests run)
No errors reported in the saved eventlog file.
No errors reported in during the database and log checksum process.
Primary Storage Performance Results
The Primary Storage performance testing is designed to exercise the storage with maximum
sustainable Exchange type of I/O for 2 hours. The test is to show how long it takes for the storage to
respond to an I/O under load. The data below is the sum of all of the logical disk I/O’s and average of all
the logical disks I/O latency in the 2 hours test duration. Each server is listed separately and the
aggregate numbers across all servers is listed as well.
Individual Server Metrics:
The sum of I/O’s across Storage Groups and the average latency across all Storage Groups on a per
server basis.