
Intel RAID Controller SRCSASJV 500 Mailbox Compatibility Report

Intel® 500 Mailbox Exchange Server 2007 Storage Solution
Intel
®
Server Chassis SC5400 and Server Board S5000PSL
26
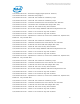
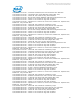
2/23/2009 6:06:52 PM -- Operation mix: Sessions 2, Inserts 25%, Deletes 10%, Replaces 50%,
Reads 15%, Lazy Commits 80%.
2/23/2009 6:07:22 PM -- Volume M: has 0.00004 for read latency slope.
2/23/2009 6:09:22 PM -- 95 batch transactions/sec and 2 sessions have 205 IOPS.
2/23/2009 6:09:22 PM -- 2 sessions have actual 205 IOPS (target IOPS: 250)
2/23/2009 6:09:22 PM -- Volume M: has 0.0125 for Avg. Disk sec/Read.
2/23/2009 6:09:22 PM -- Volume L: has 0.0026 for Avg. Disk sec/Write.
2/23/2009 6:09:22 PM -- Volume L: has 0.0000 for Avg. Disk sec/Read.
2/23/2009 6:09:22 PM -- Operation mix: Sessions 4, Inserts 25%, Deletes 10%, Replaces 50%,
Reads 15%, Lazy Commits 80%.
2/23/2009 6:09:52 PM -- Volume M: has 0.00014 for read latency slope.
2/23/2009 6:11:52 PM -- 133 batch transactions/sec and 4 sessions have 284 IOPS.
2/23/2009 6:11:52 PM -- 4 sessions have actual 284 IOPS (target IOPS: 250)
2/23/2009 6:11:52 PM -- Volume M: has 0.0225 for Avg. Disk sec/Read.
2/23/2009 6:11:52 PM -- Process has average database read latencies higher than 0.020.
2/23/2009 6:11:52 PM -- Volume L: has 0.0025 for Avg. Disk sec/Write.
2/23/2009 6:11:52 PM -- Volume L: has 0.0000 for Avg. Disk sec/Read.
2/23/2009 6:11:52 PM -- Operation mix: Sessions 2, Inserts 25%, Deletes 10%, Replaces 50%,
Reads 15%, Lazy Commits 80%.
2/23/2009 6:12:22 PM -- Volume M: has 0.00023 for read latency slope.
2/23/2009 6:14:22 PM -- 98 batch transactions/sec and 2 sessions have 206 IOPS.
2/23/2009 6:14:22 PM -- 2 sessions have actual 206 IOPS (target IOPS: 250)
2/23/2009 6:14:22 PM -- Volume M: has 0.0130 for Avg. Disk sec/Read.
2/23/2009 6:14:22 PM -- Volume L: has 0.0024 for Avg. Disk sec/Write.
2/23/2009 6:14:22 PM -- Volume L: has 0.0000 for Avg. Disk sec/Read.
2/23/2009 6:14:22 PM -- Operation mix: Sessions 4, Inserts 25%, Deletes 10%, Replaces 50%,
Reads 15%, Lazy Commits 80%.
2/23/2009 6:14:52 PM -- Volume M: has 0.00012 for read latency slope.
2/23/2009 6:16:52 PM -- 139 batch transactions/sec and 4 sessions have 280 IOPS.
2/23/2009 6:16:52 PM -- 4 sessions have actual 280 IOPS (target IOPS: 250)
2/23/2009 6:16:52 PM -- Volume M: has 0.0155 for Avg. Disk sec/Read.
2/23/2009 6:16:52 PM -- Volume L: has 0.0025 for Avg. Disk sec/Write.
2/23/2009 6:16:52 PM -- Volume L: has 0.0000 for Avg. Disk sec/Read.
2/23/2009 6:16:53 PM -- Performance logging ends.
2/23/2009 6:16:53 PM -- Automatic tuning succeeded.
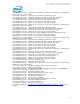
2/23/2009 6:16:54 PM -- Operation mix: Sessions 4, Inserts 25%, Deletes 10%, Replaces 50%,
Reads 15%, Lazy Commits 80%.
2/23/2009 6:16:54 PM -- Performance logging begins (interval: 15000 ms).
2/23/2009 6:16:54 PM -- Attaining prerequisites:
2/23/2009 6:16:54 PM -- \Database(JetstressWin)\Database Cache Size, Last: 268238800.0
(lower bound: 241591900.0, upper bound: none)
2/23/2009 8:16:56 PM -- Performance logging ends.
2/23/2009 8:16:56 PM -- JetInterop batch transaction stats: 74727.
2/23/2009 8:16:57 PM -- Dispatching transactions ends.
2/23/2009 8:16:57 PM -- Shutting down databases ...
2/23/2009 8:17:14 PM -- Instance796.1 (complete)
2/23/2009 8:17:14 PM -- Performance logging begins (interval: 7500 ms).
2/23/2009 8:17:14 PM -- Verifying database checksums ...
2/23/2009 8:36:55 PM -- M: (100% processed)
2/23/2009 8:36:56 PM -- Performance logging ends.
2/23/2009 8:36:56 PM --
C:\Data\Jetstress\DBChecksum_2009_2_23_20_17_14.blg
has 157
samples.