
Intel RAID Controller SRCSASJV 1200 Mailbox Compatibility Report

Intel® 1200 Mailbox Exchange Server 2007 Storage Solution
Intel
®
Server Chassis SC5400 and Server Board S5000PSL
17
Lazy commits 80%
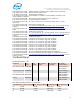
Disk Subsystem Performance
LogicalDisk Avg. Disk
sec/Read
Avg. Disk
sec/Write
Disk
Reads/sec
Disk
Writes/sec
Avg. Disk
Bytes/Write
Database
(M:)
0.018 0.018 68.175 66.564 (n/a)
Database
(N:)
0.019 0.023 68.278 65.879 (n/a)
Database
(O:)
0.020 0.032 69.341 67.272 (n/a)
Log (Q:) 0.000 0.001 0.000 43.258 10721.727
Log (R:) 0.000 0.001 0.000 43.651 10586.036
Log (S:) 0.000 0.001 0.000 43.727 10775.536
Host System Performance
Counter Average Minimum Maximum
% Processor Time 0.554 0.247 1.042
Available MBytes 2589.385 2486.000 2606.000
Free System Page Table Entries 4170771.000 4170771.000 4170771.000
Transition Pages RePurposed/sec
0.000 0.000 0.000
Pool Nonpaged Bytes 35776682.667
35770368.000
35794944.000
Pool Paged Bytes 44884659.200
44765184.000
44916736.000
Database Page Fault Stalls/sec 0.000 0.000 0.000
Test Log
1/14/2009 6:53:17 PM -- Jetstress testing begins ...
1/14/2009 6:53:17 PM -- Prepare testing begins ...
1/14/2009 6:53:17 PM -- Creating M:\Jetstress1.edb.
1/14/2009 6:53:17 PM -- Database cache settings: (minimum: 32.0 MB, maximum: 256.0 MB)
1/14/2009 6:53:17 PM -- Database flush thresholds: (start: 2.6 MB, stop: 5.1 MB)
1/14/2009 7:18:10 PM -- 60.0% of 97.7 GB complete (3570604 records inserted).
1/14/2009 7:37:28 PM -- 100.0% of 97.7 GB complete (5985906 records inserted).
1/14/2009 7:37:30 PM -- Duplicating 2 databases:
1/14/2009 8:21:43 PM -- 100.0% of 195.3 GB complete (195.3 GB duplicated).
1/14/2009 8:21:47 PM -- Attaching databases ...
1/14/2009 8:21:47 PM -- Prepare testing ends.
1/14/2009 8:21:47 PM -- Dispatching transactions begins ...
1/14/2009 8:21:47 PM -- Database cache settings: (minimum: 96.0 MB, maximum: 768.0 MB)
1/14/2009 8:21:47 PM -- Database flush thresholds: (start: 7.7 MB, stop: 15.4 MB)
1/14/2009 8:21:51 PM -- Database read latency thresholds: (average: 0.02 seconds/read,
maximum: 0.05 seconds/read).
1/14/2009 8:21:51 PM -- Log write latency thresholds: (average: 0.01 seconds/write,
maximum: 0.05 seconds/write).
1/14/2009 8:21:52 PM -- Operation mix: Sessions 4, Inserts 25%, Deletes 10%, Replaces 50%,
Reads 15%, Lazy Commits 80%.
1/14/2009 8:21:52 PM -- Performance logging begins (interval: 15000 ms).
1/14/2009 8:21:52 PM -- Attaining prerequisites:
1/14/2009 8:34:08 PM -- \Database(JetstressWin)\Database Cache Size, Last: 725483500.0
(lower bound: 724775700.0, upper bound: none)
1/14/2009 10:34:10 PM -- Performance logging ends.