
Intel RAID Controller SRCSASRB 1800 Mailbox Compatibility Report
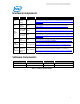
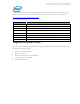
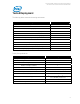

Table Of Contents
- Microsoft Exchange Server Jetstress
- 3/5/2009 7:41:26 PM -- Jetstress testing begins ...3/5/2009 7:41:26 PM -- Prepare testing begins ...3/5/2009 7:41:32 PM -- Attaching databases ...3/5/2009 7:41:32 PM -- Prepare testing ends.3/5/2009 7:41:32 PM -- Dispatching transactions begins ...3/5/2009 7:41:32 PM -- Database cache settings: (minimum: 128.0 MB, maximum: 1.0 GB)3/5/2009 7:41:32 PM -- Database flush thresholds: (start: 10.2 MB, stop: 20.5 MB)3/5/2009 7:41:37 PM -- Database read latency thresholds: (average: 0.02 seconds/read, maximum: 0.1 seconds/read).3/5/2009 7:41:37 PM -- Log write latency thresholds: (average: 0.01 seconds/write, maximum: 0.1 seconds/write).3/5/2009 7:41:39 PM -- Operation mix: Sessions 12, Inserts 25%, Deletes 10%, Replaces 50%, Reads 15%, Lazy Commits 80%.3/5/2009 7:41:39 PM -- Performance logging begins (interval: 15000 ms).3/5/2009 7:41:39 PM -- Attaining prerequisites: 3/5/2009 7:47:42 PM -- \Database (JetstressWin)\Database Cache Size, Last: 967401500.0 (lower bound: 966367600.0, upper bound: none)3/6/2009 7:47:44 PM -- Performance logging ends.3/6/2009 7:47:44 PM -- JetInterop batch transaction stats: 569497, 569587, 570316, and 570129.3/6/2009 7:48:47 PM -- Dispatching transactions ends.3/6/2009 7:48:47 PM -- Shutting down databases ...3/6/2009 9:24:10 PM -- Instance2840.1 (complete), Instance2840.2 (complete), Instance2840.3 (complete), and Instance2840.4 (complete)3/6/2009 9:24:11 PM -- Performance logging begins (interval: 30000 ms).3/6/2009 9:24:11 PM -- Verifying database checksums ...3/6/2009 10:10:32 PM -- M: (100% processed), N: (100% processed), O: (100% processed), and P: (100% processed)3/6/2009 10:10:33 PM -- Performance logging ends.3/6/2009 10:10:33 PM -- C:\Data\Jetstress\DBChecksum_2009_3_6_21_24_10.blg has 92 samples.3/6/2009 10:10:37 PM -- C:\Data\Jetstress\DBChecksum_2009_3_6_21_24_10.html is saved.3/6/2009 10:10:37 PM -- Verifying log checksums ...3/6/2009 10:10:41 PM -- L:\01 (8 logs passed), L:\02 (22 logs passed), L:\03 (22 logs passed), and L:\04 (21 logs passed)3/6/2009 10:10:41 PM -- C:\Data\Jetstress\Stress_2009_3_5_19_41_37.blg has 5784 samples.3/6/2009 10:10:41 PM -- Creating test report ...3/6/2009 10:11:47 PM -- Volume M: has 0.0158 for Avg. Disk sec/Read.3/6/2009 10:11:47 PM -- Volume N: has 0.0165 for Avg. Disk sec/Read.3/6/2009 10:11:47 PM -- Volume O: has 0.0151 for Avg. Disk sec/Read.3/6/2009 10:11:47 PM -- Volume P: has 0.0173 for Avg. Disk sec/Read.3/6/2009 10:11:47 PM -- Volume L: has 0.0045 for Avg. Disk sec/Write.3/6/2009 10:11:47 PM -- Volume L: has 0.0000 for Avg. Disk sec/Read.3/6/2009 10:11:47 PM -- Test has 4.86722147380135 Maximum Database Page Fault Stalls/sec.3/6/2009 10:11:47 PM -- Test has 0 Database Page Fault Stalls/sec samples higher than 0.3/6/2009 10:11:47 PM -- C:\Data\Jetstress\Stress_2009_3_5_19_41_37.xml has 5759 samples queried.
- Microsoft Exchange Server Jetstress
- Microsoft Exchange Server Jetstress
- 3/5/2009 8:47:51 AM -- Jetstress testing begins ...3/5/2009 8:47:51 AM -- Prepare testing begins ...3/5/2009 8:47:58 AM -- Attaching databases ...3/5/2009 8:47:58 AM -- Prepare testing ends.3/5/2009 8:47:58 AM -- Dispatching transactions begins ...3/5/2009 8:47:58 AM -- Database cache settings: (minimum: 128.0 MB, maximum: 1.0 GB)3/5/2009 8:47:58 AM -- Database flush thresholds: (start: 10.2 MB, stop: 20.5 MB)3/5/2009 8:48:03 AM -- Database read latency thresholds: (average: 0.02 seconds/read, maximum: 0.05 seconds/read).3/5/2009 8:48:03 AM -- Log write latency thresholds: (average: 0.01 seconds/write, maximum: 0.05 seconds/write).3/5/2009 8:48:05 AM -- Operation mix: Sessions 12, Inserts 25%, Deletes 10%, Replaces 50%, Reads 15%, Lazy Commits 80%.3/5/2009 8:48:05 AM -- Performance logging begins (interval: 15000 ms).3/5/2009 8:48:05 AM -- Attaining prerequisites:3/5/2009 8:54:13 AM -- \Database(JetstressWin)\Database Cache Size, Last: 968089600.0 (lower bound: 966367600.0, upper bound: none)3/5/2009 10:54:15 AM -- Performance logging ends.3/5/2009 10:54:15 AM -- JetInterop batch transaction stats: 57614, 56979, 57398, and 57460.3/5/2009 10:54:16 AM -- Dispatching transactions ends.3/5/2009 10:54:16 AM -- Shutting down databases ...3/5/2009 10:54:35 AM -- Instance2304.1 (complete), Instance2304.2 (complete), Instance2304.3 (complete), and Instance2304.4 (complete)3/5/2009 10:54:35 AM -- Performance logging begins (interval: 15000 ms).3/5/2009 10:54:35 AM -- Verifying database checksums ...3/5/2009 11:33:36 AM -- M: (100% processed), N: (100% processed), O: (100% processed), and P: (100% processed)3/5/2009 11:33:37 AM -- Performance logging ends.3/5/2009 11:33:37 AM -- C:\Data\Jetstress\DBChecksum_2009_3_5_10_54_35.blg has 156 samples.3/5/2009 11:33:43 AM -- C:\Data\Jetstress\DBChecksum_2009_3_5_10_54_35.html is saved.3/5/2009 11:33:43 AM -- Verifying log checksums ...3/5/2009 11:33:48 AM -- L:\01 (22 logs passed), L:\02 (22 logs passed), L:\03 (22 logs passed), and L:\04 (22 logs passed)3/5/2009 11:33:48 AM -- C:\Data\Jetstress\Performance_2009_3_5_8_48_3.blg has 504 samples.3/5/2009 11:33:48 AM -- Creating test report ...3/5/2009 11:33:54 AM -- Volume M: has 0.0161 for Avg. Disk sec/Read.3/5/2009 11:33:54 AM -- Volume N: has 0.0167 for Avg. Disk sec/Read.3/5/2009 11:33:54 AM -- Volume O: has 0.0153 for Avg. Disk sec/Read.3/5/2009 11:33:54 AM -- Volume P: has 0.0173 for Avg. Disk sec/Read.3/5/2009 11:33:54 AM -- Volume L: has 0.0051 for Avg. Disk sec/Write.3/5/2009 11:33:54 AM -- Volume L: has 0.0000 for Avg. Disk sec/Read.3/5/2009 11:33:54 AM -- Test has 0 Maximum Database Page Fault Stalls/sec.3/5/2009 11:33:54 AM -- Test has 0 Database Page Fault Stalls/sec samples higher than 0.3/5/2009 11:33:54 AM -- C:\Data\Jetstress\Performance_2009_3_5_8_48_3.xml has 479 samples queried.Microsoft Exchange Server Jetstress
Intel® 1800 Mailbox Exchange Server 2007 Storage Solution
Intel
®
Server Chassis SC5400 and Server Board S5000PSL
8
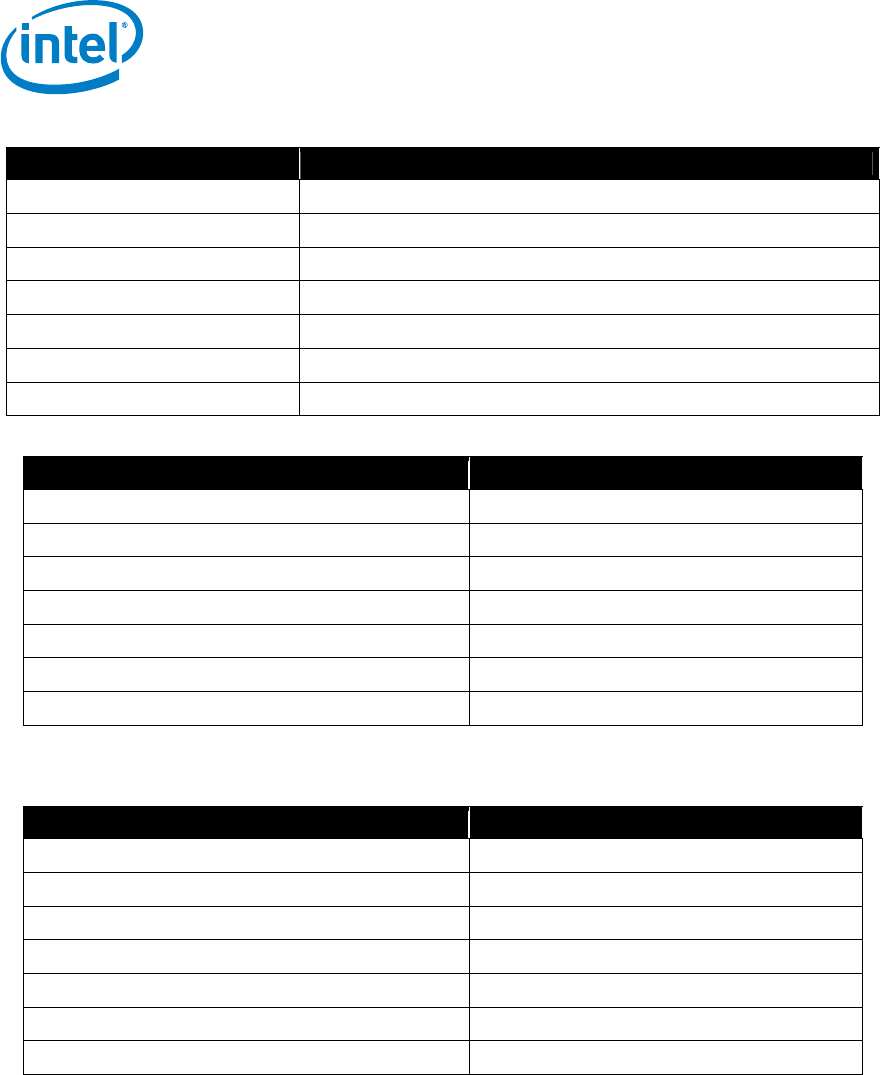
Primary Storage Software
Component Description
HBA driver Intel
®
SRCSASRB
HBA Queue Target Setting N/A
HBA Queue Depth Setting N/A
Multi-Pathing N/A
Host OS MS Windows Server 2003 R2 Enterprise x64 Edition w/ Service Pack 1
ESE.dll file version 08.00.0685.024
Replication solution name / version N/A
Primary Storage Disk Configuration (Mailbox Store Disks)
Component Description
Disk type, speed and firmware revision Seagate SAS, 15K RPM, 0002 (ST3146855SS)
Raw capacity per disk (GB) 136.7
Number of physical disks in test 8
Total raw storage capacity (GB) 1093.6
Number of slices per LUN or number of disks per LUN 2
RAID level RAID 10
Total formatted capacity 544
Primary Storage Disk Configuration (Transactional Log Disks)
Component Description
Disk type, speed and firmware revision Seagate SAS, 15K RPM, 0002 (ST3146855SS)
Raw capacity per disk (GB) 136.7
Number of physical disks in test 2
Total raw storage capacity (GB) 273.4
Number of slices per LUN or number of disks per LUN 2
RAID level RAID 1
Total formatted capacity 136.0