
Intel RAID Controller SRCSASRB 1800 Mailbox Compatibility Report
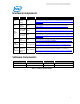
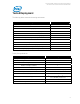
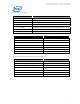

Table Of Contents
- Microsoft Exchange Server Jetstress
- 3/5/2009 7:41:26 PM -- Jetstress testing begins ...3/5/2009 7:41:26 PM -- Prepare testing begins ...3/5/2009 7:41:32 PM -- Attaching databases ...3/5/2009 7:41:32 PM -- Prepare testing ends.3/5/2009 7:41:32 PM -- Dispatching transactions begins ...3/5/2009 7:41:32 PM -- Database cache settings: (minimum: 128.0 MB, maximum: 1.0 GB)3/5/2009 7:41:32 PM -- Database flush thresholds: (start: 10.2 MB, stop: 20.5 MB)3/5/2009 7:41:37 PM -- Database read latency thresholds: (average: 0.02 seconds/read, maximum: 0.1 seconds/read).3/5/2009 7:41:37 PM -- Log write latency thresholds: (average: 0.01 seconds/write, maximum: 0.1 seconds/write).3/5/2009 7:41:39 PM -- Operation mix: Sessions 12, Inserts 25%, Deletes 10%, Replaces 50%, Reads 15%, Lazy Commits 80%.3/5/2009 7:41:39 PM -- Performance logging begins (interval: 15000 ms).3/5/2009 7:41:39 PM -- Attaining prerequisites: 3/5/2009 7:47:42 PM -- \Database (JetstressWin)\Database Cache Size, Last: 967401500.0 (lower bound: 966367600.0, upper bound: none)3/6/2009 7:47:44 PM -- Performance logging ends.3/6/2009 7:47:44 PM -- JetInterop batch transaction stats: 569497, 569587, 570316, and 570129.3/6/2009 7:48:47 PM -- Dispatching transactions ends.3/6/2009 7:48:47 PM -- Shutting down databases ...3/6/2009 9:24:10 PM -- Instance2840.1 (complete), Instance2840.2 (complete), Instance2840.3 (complete), and Instance2840.4 (complete)3/6/2009 9:24:11 PM -- Performance logging begins (interval: 30000 ms).3/6/2009 9:24:11 PM -- Verifying database checksums ...3/6/2009 10:10:32 PM -- M: (100% processed), N: (100% processed), O: (100% processed), and P: (100% processed)3/6/2009 10:10:33 PM -- Performance logging ends.3/6/2009 10:10:33 PM -- C:\Data\Jetstress\DBChecksum_2009_3_6_21_24_10.blg has 92 samples.3/6/2009 10:10:37 PM -- C:\Data\Jetstress\DBChecksum_2009_3_6_21_24_10.html is saved.3/6/2009 10:10:37 PM -- Verifying log checksums ...3/6/2009 10:10:41 PM -- L:\01 (8 logs passed), L:\02 (22 logs passed), L:\03 (22 logs passed), and L:\04 (21 logs passed)3/6/2009 10:10:41 PM -- C:\Data\Jetstress\Stress_2009_3_5_19_41_37.blg has 5784 samples.3/6/2009 10:10:41 PM -- Creating test report ...3/6/2009 10:11:47 PM -- Volume M: has 0.0158 for Avg. Disk sec/Read.3/6/2009 10:11:47 PM -- Volume N: has 0.0165 for Avg. Disk sec/Read.3/6/2009 10:11:47 PM -- Volume O: has 0.0151 for Avg. Disk sec/Read.3/6/2009 10:11:47 PM -- Volume P: has 0.0173 for Avg. Disk sec/Read.3/6/2009 10:11:47 PM -- Volume L: has 0.0045 for Avg. Disk sec/Write.3/6/2009 10:11:47 PM -- Volume L: has 0.0000 for Avg. Disk sec/Read.3/6/2009 10:11:47 PM -- Test has 4.86722147380135 Maximum Database Page Fault Stalls/sec.3/6/2009 10:11:47 PM -- Test has 0 Database Page Fault Stalls/sec samples higher than 0.3/6/2009 10:11:47 PM -- C:\Data\Jetstress\Stress_2009_3_5_19_41_37.xml has 5759 samples queried.
- Microsoft Exchange Server Jetstress
- Microsoft Exchange Server Jetstress
- 3/5/2009 8:47:51 AM -- Jetstress testing begins ...3/5/2009 8:47:51 AM -- Prepare testing begins ...3/5/2009 8:47:58 AM -- Attaching databases ...3/5/2009 8:47:58 AM -- Prepare testing ends.3/5/2009 8:47:58 AM -- Dispatching transactions begins ...3/5/2009 8:47:58 AM -- Database cache settings: (minimum: 128.0 MB, maximum: 1.0 GB)3/5/2009 8:47:58 AM -- Database flush thresholds: (start: 10.2 MB, stop: 20.5 MB)3/5/2009 8:48:03 AM -- Database read latency thresholds: (average: 0.02 seconds/read, maximum: 0.05 seconds/read).3/5/2009 8:48:03 AM -- Log write latency thresholds: (average: 0.01 seconds/write, maximum: 0.05 seconds/write).3/5/2009 8:48:05 AM -- Operation mix: Sessions 12, Inserts 25%, Deletes 10%, Replaces 50%, Reads 15%, Lazy Commits 80%.3/5/2009 8:48:05 AM -- Performance logging begins (interval: 15000 ms).3/5/2009 8:48:05 AM -- Attaining prerequisites:3/5/2009 8:54:13 AM -- \Database(JetstressWin)\Database Cache Size, Last: 968089600.0 (lower bound: 966367600.0, upper bound: none)3/5/2009 10:54:15 AM -- Performance logging ends.3/5/2009 10:54:15 AM -- JetInterop batch transaction stats: 57614, 56979, 57398, and 57460.3/5/2009 10:54:16 AM -- Dispatching transactions ends.3/5/2009 10:54:16 AM -- Shutting down databases ...3/5/2009 10:54:35 AM -- Instance2304.1 (complete), Instance2304.2 (complete), Instance2304.3 (complete), and Instance2304.4 (complete)3/5/2009 10:54:35 AM -- Performance logging begins (interval: 15000 ms).3/5/2009 10:54:35 AM -- Verifying database checksums ...3/5/2009 11:33:36 AM -- M: (100% processed), N: (100% processed), O: (100% processed), and P: (100% processed)3/5/2009 11:33:37 AM -- Performance logging ends.3/5/2009 11:33:37 AM -- C:\Data\Jetstress\DBChecksum_2009_3_5_10_54_35.blg has 156 samples.3/5/2009 11:33:43 AM -- C:\Data\Jetstress\DBChecksum_2009_3_5_10_54_35.html is saved.3/5/2009 11:33:43 AM -- Verifying log checksums ...3/5/2009 11:33:48 AM -- L:\01 (22 logs passed), L:\02 (22 logs passed), L:\03 (22 logs passed), and L:\04 (22 logs passed)3/5/2009 11:33:48 AM -- C:\Data\Jetstress\Performance_2009_3_5_8_48_3.blg has 504 samples.3/5/2009 11:33:48 AM -- Creating test report ...3/5/2009 11:33:54 AM -- Volume M: has 0.0161 for Avg. Disk sec/Read.3/5/2009 11:33:54 AM -- Volume N: has 0.0167 for Avg. Disk sec/Read.3/5/2009 11:33:54 AM -- Volume O: has 0.0153 for Avg. Disk sec/Read.3/5/2009 11:33:54 AM -- Volume P: has 0.0173 for Avg. Disk sec/Read.3/5/2009 11:33:54 AM -- Volume L: has 0.0051 for Avg. Disk sec/Write.3/5/2009 11:33:54 AM -- Volume L: has 0.0000 for Avg. Disk sec/Read.3/5/2009 11:33:54 AM -- Test has 0 Maximum Database Page Fault Stalls/sec.3/5/2009 11:33:54 AM -- Test has 0 Database Page Fault Stalls/sec samples higher than 0.3/5/2009 11:33:54 AM -- C:\Data\Jetstress\Performance_2009_3_5_8_48_3.xml has 479 samples queried.Microsoft Exchange Server Jetstress
Intel® 1800 Mailbox Exchange Server 2007 Storage Solution
Intel
®
Server Chassis SC5400 and Server Board S5000PSL
10
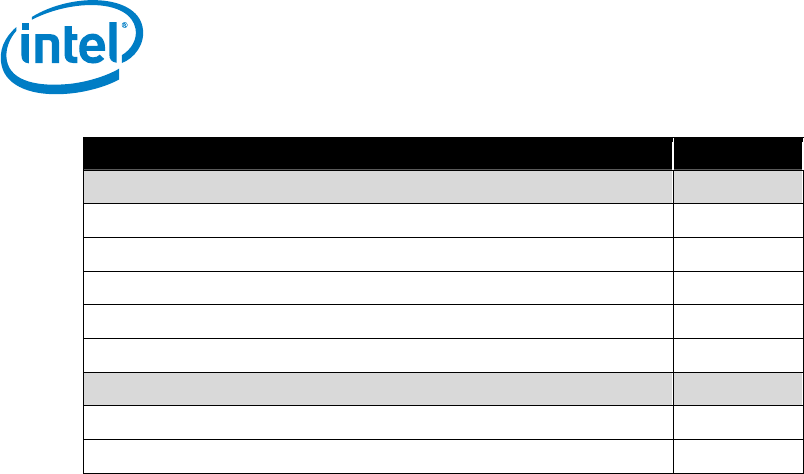
I/O Component Metric
Database I/O
Average Database Disk Transfers/sec 122.227
Average Database Disk Reads/sec 127.296
Average Database Disk Writes/sec 117.158
Average Database Disk Read Latency (ms) 0.016
Average Database Disk Write Latency (ms) 0.019
Transaction Log I/O
Average Log Disk Writes/sec 188.959
Average Log Disk Write Latency (ms) 0.005
Conclusion
This document is developed by storage solution providers, and reviewed by Microsoft Exchange
Product team. The test results/data presented in this document is based on the tests introduced in
the ESRP test framework. Customer should not quote the data directly for his/her pre-deployment
verification. It is still necessary to go through the exercises to validate the storage design for a specific
customer environment.
ESRP program is not designed to be a benchmarking program; tests are not designed to getting the
maximum throughput for a giving solution. Rather, it is focused on producing recommendations from
vendors for Exchange application. So the data presented in this document should not be used for
direct comparisons among the solutions.