
Intel RAID Controller SRCSASJV 900 Mailbox Compatibility Report


Intel® 900 Mailbox Exchange Server 2007 Storage Solution
Intel
®
Server Chassis SC5400 and Server Board S5000PSL
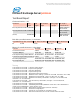
12
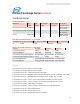
Insert operations 25%
Delete operations 10%
Replace operations 50%
Read operations 15%
Lazy commits 80%
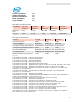
Disk Subsystem Performance
LogicalDisk Avg. Disk
sec/Read
Avg. Disk
sec/Write
Disk
Reads/sec
Disk
Writes/sec
Avg. Disk
Bytes/Write
Database
(M:)
0.015 0.036 281.798 259.457 (n/a)
Log (L:) 0.000 0.003 0.000 120.559 12984.184
Host System Performance
Counter Average Minimum Maximum
% Processor Time 0.876 0.130 3.568
Available MBytes 2878.335 2856.000 2889.000
Free System Page Table Entries 4170276.000 4170276.000 4170276.000
Transition Pages RePurposed/sec
0.000 0.000 0.000
Pool Nonpaged Bytes 33260595.911
33247232.000
33325056.000
Pool Paged Bytes 44468149.333
43569152.000
46247936.000
Database Page Fault Stalls/sec 0.000 0.000 1.067
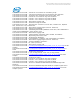
Test Log
2/19/2009 10:13:29 PM -- Jetstress testing begins ...
2/19/2009 10:13:29 PM -- Prepare testing begins ...
2/19/2009 10:13:32 PM -- Attaching databases ...
2/19/2009 10:13:32 PM -- Prepare testing ends.
2/19/2009 10:13:32 PM -- Dispatching transactions begins ...
2/19/2009 10:13:32 PM -- Database cache settings: (minimum: 64.0 MB, maximum: 512.0 MB)
2/19/2009 10:13:32 PM -- Database flush thresholds: (start: 5.1 MB, stop: 10.2 MB)
2/19/2009 10:13:35 PM -- Database read latency thresholds: (average: 0.02 seconds/read,
maximum: 0.1 seconds/read).
2/19/2009 10:13:35 PM -- Log write latency thresholds: (average: 0.01 seconds/write,
maximum: 0.1 seconds/write).
2/19/2009 10:13:35 PM -- Attaining prerequisites:
2/19/2009 10:17:44 PM -- \Database(JetstressWin)\Database Cache Size, Last: 483254300.0
(lower bound: 483183800.0, upper bound: none)
2/19/2009 10:17:45 PM -- Performance logging begins (interval: 5000 ms).
2/19/2009 10:17:45 PM -- Automatic tuning begins ...
2/19/2009 10:18:15 PM -- Volume M: has 0.00036 for read latency slope.
2/19/2009 10:20:15 PM -- 303 batch transactions/sec and 16 sessions have 657 IOPS.
2/19/2009 10:20:15 PM -- 16 sessions have actual 657 IOPS (target IOPS: 450)
2/19/2009 10:20:15 PM -- Volume M: has 0.0236 for Avg. Disk sec/Read.
2/19/2009 10:20:15 PM -- Process has average database read latencies higher than 0.020.
2/19/2009 10:20:15 PM -- Volume L: has 0.0032 for Avg. Disk sec/Write.
2/19/2009 10:20:15 PM -- Volume L: has 0.0000 for Avg. Disk sec/Read.
2/19/2009 10:20:15 PM -- Operation mix: Sessions 8, Inserts 25%, Deletes 10%, Replaces
50%, Reads 15%, Lazy Commits 80%.