
Document
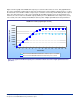


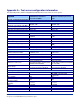

Figure 3 shows a graph of the WebBench requests per second results for the test server. This graph illustrates
the server’s performance under load for each of the 16 client mixes. As the number of clients increases, so does
the load on the server and the number of requests per second the server must perform. During the first couple of
mixes, the client count is low, so the server can handle the load with capacity to spare. As the load increases,
however, the server reaches its maximum capacity and the processor utilization becomes 100 percent (or very
close to that). The curves below peak and flatten at those points. A higher peak indicates better performance.
Figure 3: Line graph of the WebBench requests per second results for the two test servers. A higher peak indicates better
performance.
WebBench results (requests per second)
0
5000
10000
15000
20000
25000
30000
35000
40000
45000
12345678910111213141516
Client mixes
Requests per Second
Intel Server Board SE7520AF2 w ith Dual-Core Intel Xeon processor 2.80GHz
Intel Server Board S5000PAL w ith Dual-Core Intel Xeon processor 5160
3
Principled Technologies, Inc.: Intel Server Board S5000PAL with Intel
Xeon processor 5160 WebBench 5.0 performance report