
Intel RAID Controller SRCSASRB 900 Mailbox Compatibility Report

Intel® 900 Mailbox Exchange Server 2007 Storage Solution
Intel
®
Server Chassis SC5400 and Server Board S5000PSL
Microsoft Exchange Server Jetstress
Test Result Report
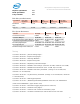
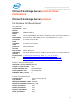
Checksum Statistics - All
Seen
pages
Bad
pages
Correctable
pages
Wrong page
no pages
File length /
seconds taken
Database
M:\01\Jetstress1.edb
17823896
0 0 0 139249 MBytes /
632 seconds
M:\02\Jetstress1.edb
17811360
0 0 0 139151 MBytes /
656 seconds
(Sum) 35635256
0 0 0 278400 MBytes /
1289 seconds
Disk Subsystem Performance (of checksum)
LogicalDisk
Avg. Disk sec/Read
Avg. Disk sec/Write
Disk Reads/sec
Disk Writes/sec
M: 0.065 0.000 3448.129 0.002
Memory System Performance (of checksum)
Average Minimum Maximum Counter
% Processor Time 3.867 2.408 4.570
3365.694 3358.000 3368.000 Available MBytes
Free System Page Table Entries 4170276.000 4170276.000 4170276.000
Transition Pages RePurposed/sec
0.000 0.000 0.000
34751668.706
34729984.000
34779136.000
Pool Nonpa
ged Bytes
48630651.482
48312320.000
49381376.000
Pool Paged Bytes
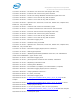
Test Log
3/7/2009 7:38:06 PM -- Jetstress testing begins ...
3/7/2009 7:38:06 PM -- Prepare testing begins ...
3/7/2009 7:38:08 PM -- Attaching databases ...
3/7/2009 7:38:08 PM -- Prepare testing ends.
3/7/2009 7:38:08 PM -- Dispatching transactions begins ...
3/7/2009 7:38:08 PM -- Database cache settings: (minimum: 64.0 MB, maximum: 512.0 MB)
3/7/2009 7:38:08 PM -- Database flush thresholds: (start: 5.1 MB, stop: 10.2 MB)
3/7/2009 7:38:11 PM -- Database read latency thresholds: (average: 0.02 seconds/read,
maximum: 0.1 seconds/read).
3/7/2009 7:38:11 PM -- Log write latency thresholds: (average: 0.01 seconds/write, maximum:
0.1 seconds/write).
3/7/2009 7:38:11 PM -- Attaining prerequisites:
3/7/2009 7:42:27 PM -- \Database(JetstressWin)\Database Cache Size, Last: 485335000.0
(lower bound: 483183800.0, upper bound: none)
3/7/2009 7:42:28 PM -- Performance logging begins (interval: 5000 ms).
3/7/2009 7:42:28 PM -- Automatic tuning begins ...
3/7/2009 7:42:58 PM -- Volume M: has 0.00028 for read latency slope.
3/7/2009 7:44:58 PM -- 311 batch transactions/sec and 16 sessions have 701 IOPS.
3/7/2009 7:44:58 PM -- 16 sessions have actual 701 IOPS (target IOPS: 450)
3/7/2009 7:44:58 PM -- Volume M: has 0.0224 for Avg. Disk sec/Read.
3/7/2009 7:44:58 PM -- Process has average database read latencies higher than 0.020.
15