
Intel RAID Controller SRCSASRB 800 Mailbox Compatibility Report

Intel® 800 Mailbox Exchange Server 2007 Storage Solution
Intel
®
Server Chassis SC5400 and Server Board S5000PSL
17
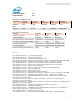
Read operations 15%
Lazy commits 80%
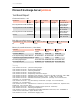
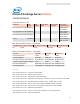
Disk Subsystem Performance
LogicalDisk Avg. Disk
sec/Read
Avg. Disk
sec/Write
Disk
Reads/sec
Disk
Writes/sec
Avg. Disk
Bytes/Write
Database
(M:)
0.018 0.048 159.550 159.335 (n/a)
Log (L:) 0.000 0.001 0.000 108.685 10458.449
Host System Performance
Counter Average Minimum Maximum
% Processor Time 0.443 0.182 0.898
Available MBytes 2501.544 2469.000 2540.000
Free System Page Table Entries 4170416.000 4170416.000 4170416.000
Transition Pages RePurposed/sec
0.000 0.000 0.000
Pool Nonpaged Bytes 34375475.200
34365440.000
34406400.000
Pool Paged Bytes 46085179.733
45965312.000
46764032.000
Database Page Fault Stalls/sec 0.000 0.000 0.000
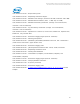
Test Log
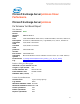
3/21/2009 4:28:29 PM -- Jetstress testing begins ...
3/21/2009 4:28:29 PM -- Prepare testing begins ...
3/21/2009 4:28:29 PM -- Creating M:\01\Jetstress1.edb.
3/21/2009 4:28:29 PM -- Database cache settings: (minimum: 32.0 MB, maximum: 256.0 MB)
3/21/2009 4:28:29 PM -- Database flush thresholds: (start: 2.6 MB, stop: 5.1 MB)
3/21/2009 4:58:49 PM -- 60.0% of 65.1 GB complete (2380362 records inserted).
3/21/2009 5:21:11 PM -- 100.0% of 65.1 GB complete (3803194 records inserted).
3/21/2009 5:21:17 PM -- Duplicating 2 databases:
3/21/2009 6:10:37 PM -- 100.0% of 130.2 GB complete (130.2 GB duplicated).
3/21/2009 6:10:40 PM -- Attaching databases ...
3/21/2009 6:10:40 PM -- Prepare testing ends.
3/21/2009 6:10:40 PM -- Dispatching transactions begins ...
3/21/2009 6:10:40 PM -- Database cache settings: (minimum: 96.0 MB, maximum: 768.0 MB)
3/21/2009 6:10:40 PM -- Database flush thresholds: (start: 7.7 MB, stop: 15.4 MB)
3/21/2009 6:10:44 PM -- Database read latency thresholds: (average: 0.02 seconds/read,
maximum: 0.05 seconds/read).
3/21/2009 6:10:44 PM -- Log write latency thresholds: (average: 0.01 seconds/write,
maximum: 0.05 seconds/write).
3/21/2009 6:10:45 PM -- Operation mix: Sessions 3, Inserts 25%, Deletes 10%, Replaces 50%,
Reads 15%, Lazy Commits 80%.
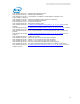
3/21/2009 6:10:45 PM -- Performance logging begins (interval: 15000 ms).
3/21/2009 6:10:45 PM -- Attaining prerequisites:
3/21/2009 6:26:52 PM -- \Database(JetstressWin)\Database Cache Size, Last: 725057500.0
(lower bound: 724775700.0, upper bound: none)
3/21/2009 8:26:53 PM -- Performance logging ends.
3/21/2009 8:26:53 PM -- JetInterop batch transaction stats: 27118, 27280, and 27461.