
Intel RAID Controller SRCSASRB 550 Mailbox Compatibility Report
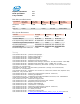
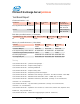
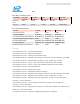
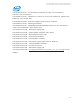
Table Of Contents
- Microsoft Exchange Server Jetstress
- 3/20/2009 9:06:45 AM -- Jetstress testing begins ...3/20/2009 9:06:45 AM -- Prepare testing begins ...3/20/2009 9:06:46 AM -- Attaching databases ...3/20/2009 9:06:46 AM -- Prepare testing ends.3/20/2009 9:06:46 AM -- Dispatching transactions begins ...3/20/2009 9:06:46 AM -- Database cache settings: (minimum: 32.0 MB, maximum: 256.0 MB)3/20/2009 9:06:46 AM -- Database flush thresholds: (start: 2.6 MB, stop: 5.1 MB)3/20/2009 9:06:48 AM -- Database read latency thresholds: (average: 0.02 seconds/read, maximum: 0.1 seconds/read).3/20/2009 9:06:48 AM -- Log write latency thresholds: (average: 0.01 seconds/write, maximum: 0.1 seconds/write).3/20/2009 9:06:49 AM -- Operation mix: Sessions 3, Inserts 25%, Deletes 10%, Replaces 50%, Reads 15%, Lazy Commits 80%.3/20/2009 9:06:49 AM -- Performance logging begins (interval: 15000 ms).3/20/2009 9:06:49 AM -- Attaining prerequisites:3/20/2009 9:16:10 AM -- \Database(JetstressWin)\Database Cache Size, Last: 241655800.0 (lower bound: 241591900.0, upper bound: none)3/21/2009 9:16:12 AM -- Performance logging ends.3/21/2009 9:16:12 AM -- JetInterop batch transaction stats: 381237.3/21/2009 9:16:12 AM -- Dispatching transactions ends.3/21/2009 9:16:12 AM -- Shutting down databases ...3/21/2009 9:16:49 AM -- Instance2700.1 (complete)3/21/2009 9:16:49 AM -- Performance logging begins (interval: 15000 ms).3/21/2009 9:16:49 AM -- Verifying database checksums ...3/21/2009 9:46:33 AM -- M: (100% processed)3/21/2009 9:46:34 AM -- Performance logging ends.3/21/2009 9:46:34 AM -- C:\Data\Jetstress\DBChecksum_2009_3_21_9_16_49.blg has 118 samples.3/21/2009 9:46:37 AM -- C:\Data\Jetstress\DBChecksum_2009_3_21_9_16_49.html is saved.3/21/2009 9:46:37 AM -- Verifying log checksums ...3/21/2009 9:46:38 AM -- L:\01 (22 logs passed)3/21/2009 9:46:38 AM -- C:\Data\Jetstress\Stress_2009_3_20_9_6_48.blg has 5797 samples.3/21/2009 9:46:38 AM -- Creating test report ...3/21/2009 9:47:30 AM -- Volume M: has 0.0170 for Avg. Disk sec/Read.3/21/2009 9:47:30 AM -- Volume L: has 0.0008 for Avg. Disk sec/Write.3/21/2009 9:47:30 AM -- Volume L: has 0.0000 for Avg. Disk sec/Read.3/21/2009 9:47:30 AM -- Test has 0 Maximum Database Page Fault Stalls/sec.3/21/2009 9:47:30 AM -- Test has 0 Database Page Fault Stalls/sec samples higher than 0.3/21/2009 9:47:30 AM -- C:\Data\Jetstress\Stress_2009_3_20_9_6_48.xml has 5759 samples queried.
- Microsoft Exchange Server Jetstress
- Microsoft Exchange Server Jetstress 2 Hour Performance
- Microsoft Exchange Server Jetstress
- Microsoft Exchange Server Jetstress
Intel® 550 Mailbox Exchange Server 2007 Storage Solution
Intel
®
Server Chassis SC5400 and Server Board S5000PSL
Page 14 of 20
Microsoft Exchange Server Jetstress
Test Result Report
Checksum Statistics - All
Database Seen
pages
Bad
pages
Correctable
pages
Wrong page
no pages
File length /
seconds taken
M:\01\Jetstress1.edb
19704210
0 0 0 153939 MBytes /
1783 seconds
(Sum) 19704210
0 0 0 153939 MBytes /
1783 seconds
Disk Subsystem Performance (of checksum)
LogicalDisk
Avg. Disk sec/Read
Avg. Disk sec/Write
Disk Reads/sec
Disk Writes/sec
M: 0.028 0.000 1381.323 0.004
Memory System Performance (of checksum)
Counter Average Minimum Maximum
% Processor Time 1.425 1.081 1.940
Available MBytes 3385.017 3377.000 3387.000
Free System Page Table Entries 4170606.000 4170606.000 4170606.000
Transition Pages RePurposed/sec
0.000 0.000 0.000
Pool Nonpaged Bytes 34606236.203
34582528.000
34631680.000
Pool Paged Bytes 45611632.814
45133824.000
46944256.000
Test Log
3/20/2009 9:06:45 AM -- Jetstress testing begins ...
3/20/2009 9:06:45 AM -- Prepare testing begins ...
3/20/2009 9:06:46 AM -- Attaching databases ...
3/20/2009 9:06:46 AM -- Prepare testing ends.
3/20/2009 9:06:46 AM -- Dispatching transactions begins ...
3/20/2009 9:06:46 AM -- Database cache settings: (minimum: 32.0 MB, maximum: 256.0 MB)
3/20/2009 9:06:46 AM -- Database flush thresholds: (start: 2.6 MB, stop: 5.1 MB)
3/20/2009 9:06:48 AM -- Database read latency thresholds: (average: 0.02 seconds/read,
maximum: 0.1 seconds/read).
3/20/2009 9:06:48 AM -- Log write latency thresholds: (average: 0.01 seconds/write,
maximum: 0.1 seconds/write).
3/20/2009 9:06:49 AM -- Operation mix: Sessions 3, Inserts 25%, Deletes 10%, Replaces 50%,
Reads 15%, Lazy Commits 80%.
3/20/2009 9:06:49 AM -- Performance logging begins (interval: 15000 ms).