
Intel RAID Controller SRCSASJV 500 Mailbox Compatibility Report
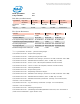

Intel® 500 Mailbox Exchange Server 2007 Storage Solution
Intel
®
Server Chassis SC5400 and Server Board S5000PSL
16
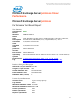
2/23/2009 8:58:44 PM -- Performance logging begins (interval: 5000 ms).
2/23/2009 8:58:44 PM -- Automatic tuning begins
2/23/2009 8:59:14 PM -- Volume M: has 0.00023 for read latency slope.
2/23/2009 9:01:14 PM -- 183 batch transactions/sec and 16 sessions have 397 IOPS.
2/23/2009 9:01:14 PM -- 16 sessions have actual 397 IOPS (target IOPS: 250)
2/23/2009 9:01:14 PM -- Volume M: has 0.0312 for Avg. Disk sec/Read.
2/23/2009 9:01:14 PM -- Process has average database read latencies higher than 0.020.
2/23/2009 9:01:14 PM -- Volume L: has 0.0024 for Avg. Disk sec/Write.
2/23/2009 9:01:14 PM -- Volume L: has 0.0000 for Avg. Disk sec/Read.
2/23/2009 9:01:14 PM -- Operation mix: Sessions 8, Inserts 25%, Deletes 10%, Replaces 50%,
Reads 15%, Lazy Commits 80%.
2/23/2009 9:01:44 PM -- Volume M: has 0.00031 for read latency slope.
2/23/2009 9:03:44 PM -- 174 batch transactions/sec and 8 sessions have 349 IOPS.
2/23/2009 9:03:44 PM -- 8 sessions have actual 349 IOPS (target IOPS: 250)
2/23/2009 9:03:44 PM -- Volume M: has 0.0252 for Avg. Disk sec/Read.
2/23/2009 9:03:44 PM -- Process has average database read latencies higher than 0.020.
2/23/2009 9:03:44 PM -- Volume L: has 0.0024 for Avg. Disk sec/Write.
2/23/2009 9:03:44 PM -- Volume L: has 0.0000 for Avg. Disk sec/Read.
2/23/2009 9:03:44 PM -- Operation mix: Sessions 4, Inserts 25%, Deletes 10%, Replaces 50%,
Reads 15%, Lazy Commits 80%.
2/23/2009 9:04:14 PM -- Volume M: has 0.00005 for read latency slope.
2/23/2009 9:06:14 PM -- 126 batch transactions/sec and 4 sessions have 272 IOPS.
2/23/2009 9:06:14 PM -- 4 sessions have actual 272 IOPS (target IOPS: 250)
2/23/2009 9:06:14 PM -- Volume M: has 0.0162 for Avg. Disk sec/Read.
2/23/2009 9:06:14 PM -- Volume L: has 0.0025 for Avg. Disk sec/Write.
2/23/2009 9:06:14 PM -- Volume L: has 0.0000 for Avg. Disk sec/Read.
2/23/2009 9:06:15 PM -- Performance logging ends.
2/23/2009 9:06:15 PM -- Automatic tuning succeeded.
2/23/2009 9:06:16 PM -- Operation mix: Sessions 4, Inserts 25%, Deletes 10%, Replaces 50%,
Reads 15%, Lazy Commits 80%.
2/23/2009 9:06:16 PM -- Performance logging begins (interval: 15000 ms).
2/23/2009 9:06:16 PM -- Attaining prerequisites:
2/23/2009 9:06:16 PM -- \Database(JetstressWin)\Database Cache Size, Last: 268435500.0
(lower bound: 241591900.0, upper bound: none)
2/24/2009 9:06:18 PM -- Performance logging ends.
2/24/2009 9:06:18 PM -- JetInterop batch transaction stats: 328050.