
Guidelines


Reference Thermal Solution
24 Intel
®
7500 Chipset Thermal Mechanical Design Guide
6.2 Heatsink Performance
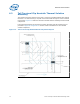
Figure 6-1 depicts the simulated thermal performance of the reference thermal solution
versus approach air velocity. Since this data was modeled at sea level, a correction
factor would be required to estimate thermal performance at other altitudes.
The following equation can be used to correct any altitude:
, and can be obtained from Figure 6-1.
Q - “velocity through HS fin area (m/s)”. Velocity is the value on X axis of Figure 6-1
alt
- Air density at given altitude
0
- Air density at sea level
Note: 8.6% power through board at high fan speed (3 m/s) and 10.5% power through board
at acoustic fan speed (1.5 m/s) are assumed
ca
Q
alt
–
+
alt
o
-------
–
=
Figure 6-1. Tall Torsional Clip Heatsink Measured Thermal Performance versus
Approach Velocity