
Optimizing-QoS-vSphere_final

UsingatrafcgeneratorsuchasNTTTCP
or NetPerftosendtrafctomultipleVMs
onahostwilldrivereceive-sidetrafcon
the port groups associated with the target
VMs, while using a VMkernel feature such
asvMotionwillshowtrafcontheport
associated with the VMkernel. This allows
the setting up of different port groups
withdifferenttrafcloadswhileusing
different kernel features to see how much
trafcisbeinggeneratedandwhatthe
maximum bandwidth is on the adapters.
There are several video demos that show
differentcongurationspostedonthe
Intel® Server Room site and YouTube*.
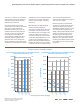
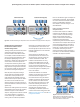
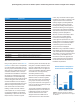
Utilizing a 10GbE connection, vMotion
under vSphere 4.1 can use up to 8 Gbps
of aggregate bandwidth, as opposed to
approximately1GbpsinESX3.5and2.6
Gbps in ESX 4.0, as shown in Figure 8.
Evenwithgreaterthan9.5Gbpsperport
being sent to the VMs, vMotion is able to
move up to eight VMs concurrently, and
VMware vCenter* Server can adjust the
amount of bandwidth allocated to vMotion
sotheVMtrafcisnotsignicantly
affected by vMotion activity.
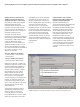
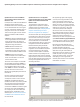
While monitoring with esxtop or resxtop,
VMkerneltrafccanbeseen,together
withalltheothertrafconthedifferent
port groups. The best practice of using
portgroupstoseparatetrafctypesisan
easy way to see how increasing one type
oftrafcaffectsothers.
The increase of vMotion bandwidth also
emphasizes the point that the advances
in VMkernel functions are driving the
need for 10GbE faster than actual
VM-generatedtrafc.Whilesomeof
these functions do not have consistent
trafc,theycanbenetfromthehigher
bandwidth that 10GbE can provide. It also
supports the move from the old GbE-
based paradigm of providing dedicated
portstospecicfunctions.Thisnew
paradigm of providing 10GbE uplinks to
thevDSandallowingalltrafctypesto
have access to the potential bandwidth
will provide increased performance while
simplifying network deployments.
Network architects should keep in mind
that to fully test a 10GbE network
connection,articiallyexaggerated
trafcmightberequired.Evenso,such
testing allows for throughput and impact
modeling that can be extremely helpful
in determining what kind of control
measures need to be deployed.
Note: When using a dependent hardware
iSCSI adapter, performance reporting for
a NIC associated with the adapter might
show little or no activity, even when iSCSI
trafcisheavy.Thisbehavioroccurs
becausetheiSCSItrafcbypassesthe
regular networking stack and needs to
be calculated into the overall network
bandwidth requirements.
VMware VMotion* Throughput in
Various Versions of VMware ESX
4
ESX 4.1ESX 4.0ESX 3.5
~1 Gbps
~2.6 Gbps
8 Gbps
Maximum
2
0
8
6
Throughput (Gbps)
Successive versions of VMware
ESX* each support higher levels of throughput
for vMotion*.
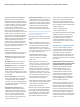
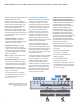
COLUMN
PORT-ID
Virtual network device port ID
UPLINK
Y means the corresponding port is an uplink; N means it is not
UP
Y means the corresponding link is up; N means it is not
SPEED
Link speed in megabits per second
FDUPLX
Y means the corresponding link is operating at full duplex; N means it is not
USED-BY
Virtual network device port user
DTYP
Virtual network device type: H means “hub” and S means “switch”
DNAME
Virtual network device name
PKTTX/s
Number of packets transmitted per second
PKTRX/s
Number of packets received per second
MbTX /s
Megabits transmitted per second
MbRX/s
Megabits received per second
%DRPTX
Percentage of transmit packets dropped
%DRPRX
Percentage of receive packets dropped
TEAM-PNIC
Name of the physical NIC used for the team uplink
PKTTXMUL/s
Number of multicast packets transmitted per second
PKTRXMUL/s
Number of multicast packets received per second
PKTTXBRD/s
Number of broadcast packets transmitted per second
PKTRXBRD/s
Number of broadcast packets received per second
Table 1. Network panel statistics
9