
Accelerating High Speed Networking with Intel I/O Acceleration Technology


White Paper Accelerating High-Speed Networking with Intel® I/O Acceleration Technology
6
12000
10000
8000
6000
4000
2000
0
60
70
80
90
100
50
40
30
20
10
0
Intel® I/O Acceleration Technology Performance Comparison
for Linux* Bidirectional Throughout and CPU % Utilization
Number of Gigabit Ethernet Ports (6 Clients per Port)
Intel® E7520-based
platform
New Dual-Core Intel® Xeon®
processor-based platform
Throughput
CPU % Utilization
Throughput
CPU % Utilization
7
24
99 99
99
15
31
56
CPU Utilization (%)
Throughput (Megabits Per Second)
Number of Gigabit Ethernet Ports (6 Clients per Port)
Intel® E7520-based
platform
New Dual-Core Intel® Xeon®
processor-based platform
Throughput
CPU % Utilization
Throughput
CPU % Utilization
Throughput (Megabits Per Second)
11
24
51
70
12000
14000
10000
8000
6000
4000
2000
0
60
70
80
90
100
50
40
30
20
10
0
Intel® I/OAT Performance Comparison for Microsoft Windows
Server 2003* Bidirectional Throughput and CPU % Utilization
CPU Utilization (%)
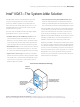
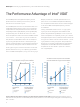
Figure 5. Network-performance comparisons for platforms with and without Intel® I/OAT. Compared to previous processors, the new
Dual-Core Intel® Xeon® processor with Intel® I/OAT provides superior performance in terms of both higher throughput and reduced percentage
of CPU utilization.
The Intel I/OAT platform-level approach to improving network
performance has been verified by extensive testing. Some of
these results are summarized in Figure 5.
The Intel I/OAT performance tests were conducted for both Linux*
and Microsoft Windows* operating systems using two Dual-Core
and Quad-Core Intel Xeon processor-based servers tested across
multiple Gigabit Ethernet (GbE) NIC ports (two to eight GbE ports)
as represented by the X-axis. One of the servers was an Intel®
E7520-based platform without the benefit of Intel I/OAT. The other
was an Intel® E5000 series server using the new Dual-Core Intel
Xeon processor with Intel I/OAT enabled. In the test examples of
Figure 5, the graphs represent both CPU utilization percentages
(the lines) and the corresponding network throughput performance
(the vertical bars). Both systems underwent identical stress tests.
The left graph in Figure 5 summarizes the results of an Intel Xeon
processor-based server running a Linux operating system. Notice
that an Intel I/OAT-enabled platform, running Linux and using eight
GbE ports, achieved a CPU utilization improvement of over 40
percent versus a non-Intel I/OAT-enabled platform. Additionally,
this same platform achieved almost twice the network throughput
as the non-Intel I/OAT-enabled platform operating under the
same conditions.
Similarly, with Microsoft Windows Server 2003* (right graph in
Figure 5), the network throughput of the Intel I/OAT-enabled
platform nearly doubled for eight GbE ports. In this test, the Intel
E7520-based platform was incapable of generating CPU utilization
data beyond four ports because, without the benefit of receive-side
scaling, the server directs all network traffic to Processor 0, saturat-
ing the processor and limiting the system’s ability to report data.
However, the new Dual-Core and Quad-Core Intel Xeon processor-
based platform with Intel I/OAT balanced the workload across
the processors and never reached 70-percent CPU utilization,
even at eight GbE ports.
The Performance Advantage of Intel® I/OAT