
Simplifying the Network with 10 Gigabit Ethernet Unified Networking


1
Intel consolidation based on replacing 15 four-year-old single-core Intel
®
Xeon
®
processor 3.8 GHz with 2M cache-based servers with one new Intel Xeon processor X5670-based server while maintaining performance as measured by SPECjbb2005*
business operations per second. Performance tests and ratings are measured using specific computer systems and/or components and reflect the approximate performance of Intel products as measured by those tests. Any difference in system hardware
or software design or configuration may affect actual performance. Buyers should consult other sources of information to evaluate the performance of systems or components they are considering purchasing. For more information, visit www.intel.com/
performance/server.
Baseline platform: Intel server platform with two 64-bit Intel Xeon processor 3.80 GHz with 2M L2 Cache, 800 FSB, 8x1 GB DDR2-400 memory, 1 hard drive, 1 power supply, Microsoft Windows* Server 2003 Ent. SP1, Oracle JRockit* build
P27.4.0-windows-x86_64 run with 2 JVM instances.
New platform: Intel server platform with two six-core Intel
®
Xeon
®
processor X5670, 2.93 GHz, 12MB L3 cache, 6.4QPI, 12 GB memory (6x2 GB DDR3-1333), 1 hard drive, 1 power supply, Microsoft Windows Server 2008 64 bit SP2, Oracle JRockit*
build P28.0.0-29 run with 2 JVM instances.
2
Intel comparison replacing 20 5-year-old single-core Intel
®
Xeon
®
processor 3.33 GHz-based servers with one new Intel Xeon processor X7560-based server. Costs have been estimated based on internal Intel analysis and are provided for informational
purposes only.
3
Based on comparison between 2S Single Core Intel
®
Xeon
®
3.80 with 2M L2 Cache and 2S Intel
®
Xeon
®
X5670-based servers. Calculation includes analysis based on performance, power, cooling, electricity rates, operating system annual license costs
and estimated server costs. This assumes 8kW racks, $0.10 per kWh, cooling costs are 2x the server power consumption costs, operating system license cost of $900/year per server, per server cost of $7200 based on estimated list prices and esti-
mated server utilization rates. All dollar figures are approximate. Performance and power comparisons are based on estimated server side java benchmark results (Intel Corporation Jan 2010). Platform power was estimated during the steady state window of
the benchmark run and at idle. Performance gain compared to baseline was 15x.
Baseline platform: Intel server platform with two 64-bit Intel Xeon processor 3.80 GHz with 2M L2 Cache, 800 FSB, 8x1GB DDR2-400 memory, 1 hard drive, 1 power supply, Microsoft Windows* Server 2003 Ent. SP1, Oracle* JRockit* build
P27.4.0-windows-x86_64 run with 2 JVM instances.
New platform: Intel server platform with two six-core Intel
®
Xeon
®
processor X5670, 2.93 GHz, 12MB L3 cache, 6.4QPI, 12 GB memory (6x2 GB DDR3-1333), 1 hard drive, 1 power supply, Microsoft Windows Server 2008 64 bit SP2, Oracle JRockit*
build P28.0.0-29 run with 2 JVM instances.
4
Intel performance comparison using SPECjbb2005* business operations per second between 5-year-old single-core Intel
®
Xeon
®
processor 3.33 GHz-based servers and one new Intel Xeon processor X7560-based server. Performance tests and ratings
are measured using specific computer systems and/or components and reflect the approximate performance of Intel products as measured by those tests. Any difference in system hardware or software design or configuration may affect actual perfor-
mance. Buyers should consult other sources of information to evaluate the performance of systems or components they are considering purchasing. For more information, visit www.intel.com/performance/server.
5
Source: Intel estimates as of January 2010. Performance comparison using SPECjbb*2005 bops (business operations per second). Results have been estimated based on internal Intel analysis and are provided for informational purposes only. Any differ-
ence in system hardware or software design or configuration may affect actual performance. For detailed calculations, configurations and assumptions refer to the legal information slide in backup.
6
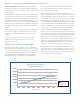
IDC, “Server Workloads Forecast,” 2009.
7
IDC, “The Internet Reaches Late Adolescence,” December 2009.
8
8x Network: 800 terabytes per second of IP traffic estimated on internal Intel analysis “Network Supply/Demand 2010-2020” forecast; 16x Storage: 60 exabytes of data stored from Barclays Capital “Storage Bits” September 2009, extrapolation by Intel
for 2015; 20x Compute: Intel internal long-range planning forecast. Extrapolated to one billion virtual servers using one virtual machine per core.
9
IDC WW Storage Systems Tracker, December 2009.
10
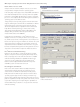
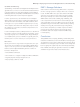
Test Configuration: Iometer v. 2006.7.27, number of managers = 1, number of workers/manager = 30 , (total number of workers) = 30, number of LUNs = 30 , number of outstanding I/Os = 50, IO size = 512B. 10 iSCSI targets with 3 LUNs per target.
Target is StarWind Enterprise configured with RAM disk. SUT: Supermicro 6026T-NTR+ , Intel
®
Xeon
®
processor W 5680 (12 M Cache, 3.33 GHz, 6.40 GT/s Intel
®
QPI), 24 GB DDR3, Windows Server* 2008 R2 x64 Network Configuration: Cisco Nexus*
5020, Intel 82599EB 10 Gigabit Ethernet Controller connected @ 10 Gbps.
INTEL MAKES NO WARRANTIES, EXPRESS OR IMPLIED, IN THIS DOCUMENT. This document is for informational purposes only.
Copyright © 2011 Intel Corporation. All rights reserved. Intel, the Intel logo, and Xeon are trademarks of Intel Corporation in the U.S. and other countries.
*Other names and brands may be claimed as the property of others.
Printed in the USA 0111/BY/OCG/XX/PDF Please Recycle 325011-001US