
NASA Case Study

The Nebula Cloud: A
Proposed Adjunct to the
Existing Cluster Approach
NASA’s Nebula is a cloud-based
infrastructure-as-a-service environment,
conceived as an alternative means of
delivering compute capacity without
the costly construction of additional
data centers. There are currently two
Nebula environments, which have been
built in modular freight containers; one
is deployed at the Goddard Space Flight
Center in Maryland, and the other is at
Ames Research Center in California.
Nebula is based on OpenStack*, an
open source software project that
enables organizations to build private
and public clouds. Backed by more than
100 companies and 1,000 developers,
OpenStack is designed to support
massively scalable cloud computing
infrastructures. Intel is actively involved
1
in the project, helping enable OpenStack to
take advantage of Intel® platform features.
The key question surrounding the viability
of Nebula as an alternative to Discover
is whether it can deliver equivalent
performance. In particular, the team
must determine whether the virtualized
environment on which Nebula is based
will introduce overhead or other factors
that will create unacceptable limitations,
compared to “bare-metal” clusters.
Test Methodology for Moving
Applications to the Cloud
To meet critical speed and latency
requirements in node-to-node
communication, NASA performance
engineers worked with Intel to employ
virtualization technologies to their
full potential. Together, the team
established a test methodology to
compare the two environments on several
workloads, including the Nuttcp network
performance measurement tool
2
, the Ohio
State University MPI Benchmarks
3
, and
the Intel® Math Kernel Library (Intel® MKL)
implementation of LINPACK
4
. Analysis
using these benchmarks enabled the
team to measure and compare system
throughput and latency between various
types of physical or virtual servers:
• Bare-metal. Data transfer between
non-virtualized servers.
• Software-only virtualization. Data
transfer between virtual machines (VMs).
• Virtualized I/O. Data transfer between
VMs with OS-based paravirtualization.
• Single-Root I/O Virtualization (SR-IOV).
Data transfer between VMs using SR-IOV.
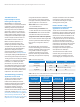
The test systems were Dell PowerEdge*
R710 servers, congured as shown in
Table 1.
As mentioned above, the purpose of
this test methodology was to determine
whether the Nebula cloud infrastructure
using 10GbE can deliver throughput
and latency equivalent to that of the
Discover cluster using InniBand. More
specically, the approach of comparing
multiple virtualization scenarios enabled
the testing to reveal the role those
virtualization technologies can play in
meeting performance goals.
Results: SR-IOV is a Key
Requirement for Moving Cluster
Applications to the Cloud
The set of test results based on the Nuttcp
benchmark is shown in Table 2; similar to the
better-known Netperf benchmark, Nuttcp
measures raw network bandwidth. In the
table, the gures for individual trials are
arranged from the top row to the bottom
starting with the lowest throughput
measure for each test scenario, through
the highest. In the testing of data transfer
from one bare-metal server to another
(the leftmost column), the highest
throughput rates come fairly near the
wire speed of the 10GbE port.
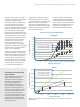
The second column of Table 2 shows
dramatic decay in throughput for the
software-only virtualization case, with
rates falling to just a few percent of full
Bare-metal VMs
Processors Two Intel® Xeon® processors E5520 @ 2.27 GHz (quad-core)
Main memory 48 GB 16 GB
OS Ubuntu* Linux* 11.04 (Kernel 2.6.38-10.server)
Hypervisor NA NA
Table 1. Test-bed configuration.
Bare Metal-to-
Bare Metal
VM-to-VM
(Software
Virtualization)
VM-to-VM
(Virtualized I/O)
VM-to-VM
(with SR-IOV)
4418.8401 Mbps 137. 3301 Mb p s 5678.0625 Mbps 8714.4063 Mbps
8028.6459 Mbps 138.5963 Mbps 5692.8146 Mbps 8958.5032 Mbps
9341.4362 Mbps 141.8702 Mbps 5746.2926 Mbps 9101.7356 Mbps
9354.0999 Mbps 145.6024 Mbps 5864.0557 Mbps 9151.5769 Mbps
9392.7072 Mbps 145.7500 Mbps 5955.8176 Mbps 9193 .110 3 Mb p s
9414.7318 Mbps 146.1043 Mbps 5973.2256 Mbps 9228.5370 Mbps
9414.8207 Mbps 146.1092 Mbps 6223.4034 Mbps 9251.8453 Mbps
9414.9368 Mbps 146.2758 Mbps 6309.8478 Mbps 9313.8894 Mbps
9415.1618 Mbps 146.3042 Mbps 6311.3896 Mbps 9348.2984 Mbps
9415.2675 Mbps 146.4449 Mbps 6316.7924 Mbps 9408.0323 Mbps
Table 2. Nuttcp results, which demonstrate that SR-IOV helps attain virtualized throughput near
wire speed, similar to that with bare-metal servers.
2
NASA’s Flexible Cloud Fabric: Moving Cluster Applications to the Cloud