
Datasheet
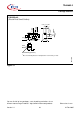

TDA4863-2
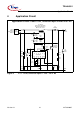
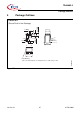
Application Circuit
Version 2.1 22 22 Feb 2005
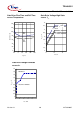
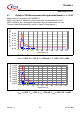
4.1 Results of THD Measurements with Application Board
P
out
= 110 W
(Measurements according to IEC61000-3-2.
150% limit (red line): Momentary measured value must be below this limit.
100% limit (blue line): Average of measured values must be below this limit.
The worst measured momentary value is shown in the diagrams.)
0,00
0,05
0,10
0,15
0,20
0,25
0,30
Current RMS(Amps)
Harmonic #
4 8 12 16 20 24 28 32 36 40
Figure 6 THD Class C:
P
max
= 110 W, V
inac
= 90 V, I
out
= 250 mA, V
out
= 420 V, PF = 0.998
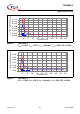
0,000
0,025
0,050
0,075
0,100
0,125
0,150
0,175
0,200
0,225
Current RMS(Amps)
Harmonic
#
4 8 12 16 20 24 28 32 36 40
Figure 7 THD Class C:
P
max
= 110 W, V
inac
= 220 V, I
out
= 250 mA, V
aout
= 420 V, PF = 0.992