
Datasheet


IRFML8244TRPbF
www.irf.com 7
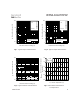
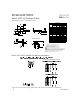
Fig 15. Typical Threshold Voltage vs.
Junction Temperature
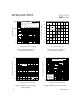
Fig 16. Typical Power vs. Time
-75 -50 -25 0 25 50 75 100 125 150
T
J
, Temperature ( °C )
0.8
1.0
1.2
1.4
1.6
1.8
2.0
2.2
2.4
2.6
V
G
S
(
t
h
)
,
G
a
t
e
t
h
r
e
s
h
o
l
d
V
o
l
t
a
g
e
(
V
)
I
D
= 10μA
I
D
= 250μA
1E-7 1E-6 1E-5 1E-4 1E-3 1E-2 1E-1 1E+0
Time (sec)
0
200
400
600
800
1000
S
i
n
g
l
e
P
u
l
s
e
P
o
w
e
r
(
W
)