
Datasheet


AUIR3313(S)
www.irf.com
8
50%
100%
150%
200%
-50 0 50 100 150
0
1
2
3
4
5
6
-50 0 50 100 150
0
2
4
6
8
10
0 10 20 30 40 50
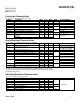
Figure 6 – Icc (mA) Vs Vcc-Vin (V)
Vcc-Vin, supply voltage (V)
Icc, supply current (mA)
Tj, junction temperature (°C)
Figure 7 – Icc off (µA) Vs Tj (°C)
Icc off, supply leakage current (µA)
0
1
2
3
4
5
6
-50 -25 0 25 50 75 100 125 150
Vifb-Vin@Isd
VIH
VIL
Tj, junction temperature (°C)
Vih, Vil and Vifb-Vin@Isd (V)
Rds(on), Drain-to-Source On Resistance
(Normalized)
Figure 8 - Normalized Rds(on) (%) Vs Tj (°C)
Tj, junction temperature (°C)
Figure 9 – Vih, Vil and Vifb-Vin@Isd (V) Vs Tj (°C)
All curves are typical characteristics. Operation in hatched areas is not recommended. Tj=25°C, Rifb=500ohm, Vcc=14V
(unless otherwise specified).