
Datasheet


AUIPS6011(S)(R)
www.irf.com
8
50%
100%
150%
200%
-50 0 50 100 150
0
5
10
15
20
25
30
35
40
-50 0 50 100 150
TO220 5°C/W
D2Pak 40°C/W
DPak 50°C/W
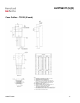
Figure 5 – Switching energy (µJ) Vs Output
current (A)
Eon, Eoff, switching energy (µJ)
Iout, Output current (A)
0
1000
2000
3000
4000
0 5 10 15
1
10
100
0.001 0.01 0.1 1 10
Tj, junction temperature (°C)
Figure 6 - Normalized Rds(on) (%) Vs Tj (°C)
Rds(on), Drain-to-Source On Resistance
(Normalized)
Figure 7 – Max. Output current (A) Vs Load
inductance (mH)
Load inductance (mH)
Iout, Output current (A)
Figure 8 – Max. ouput current (A)
Vs Ambient temperature (°C)
Ids, cont. Output current (A)
Tamb, Ambient temperature (°C)
Eon
Eoff