
Reference Guide


15 - 4
PN 074-558-P1A
3000 Micro GC Guides
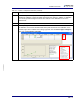
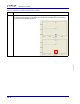
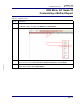
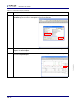
18 On the calibration curve, a blue point represents a single replicate, and a green point represents
the average of the replicates. Left-clicking on a single blue point will turn the point red and
remove it from the average calculation.
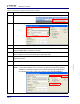
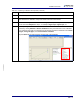
Table 15-1 Conducting a calibration with replicates (continued)
Step Description