
Manual

WindO/I-NV2 User’s Manual 11-45
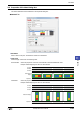
3 Pie Chart
11
Charts
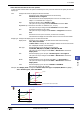
3.1 How the Pie Chart is Used
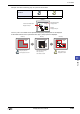
The stacked bar chart and pie chart are used to show the proportion of individual data to the sum of the data.
They can be used to check the relative change in multiple device values in real-time.
• Display the proportion of the sum of multiple device values in a stacked bar chart or a pie chart
3Pie Chart
HG3G
HG2G-5FHG2G-5SHG2G-S
HG4G HG1F HG2F HG2S HG3F HG4F
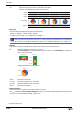
Host
MICRO/I
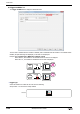
1 : 1 : 1
4 : 2 : 1
D100 :
10
D200 :
10
D300 :
10
D100 :
120
D200 :
60
D300 :
30
If the source data is all 0, the chart shows the same proportion for all the data.