
Manual

WindO/I-NV2 User’s Manual 11-1
11
Charts
This chapter describes how to configure charts and meters and their operation on the MICRO/I.
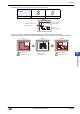
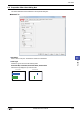
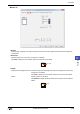
1.1 How the Bar Chart is Used
Bar charts and peak charts can be used to display word device values.
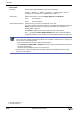
• Display word device values in a bar chart
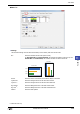
• Display word device values in a peak chart
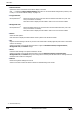
• Make the chart flash when the displayed data exceeds the maximum or minimum
Chapter 11 Charts
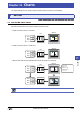
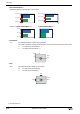
1 Bar Chart
HG3G
HG2G-5FHG2G-5SHG2G-S
HG4G HG1F HG2F HG2S HG3F HG4F
Host
MICRO/I
D100 :
-50
D200 :
120
D300 :
40
Host
MICRO/I
D100 :
-50
D200 :
120
D300 :
40
Host
MICRO/I
Range: Value
Minimum : 0
Maximum : 100
When Data Over
Flash: On
D100 :
20
D200 :
80
D300 :
40
D100 :
-50
D200 :
90
D300 :
120
Bar charts cannot be used when displayed on a vertically-installed HG1F.