
User's Guide

© IceRobotics Ltd 2015 Page 16 Release 1.1 2016
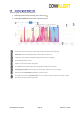
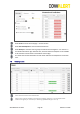
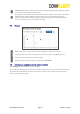
6.2
Lying Behaviour by group
From the Navigation bar, select Reports then Lying time – Groups from the drop down menu.
Hover the cursor over any of the bars to see the number of animals in that bar. Click on a bar to
create a list of those cows.
The right hand chart shows the average lying time of each group over time. Click on any of the lines
to show or hide the group on the graph.
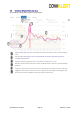
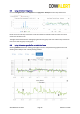
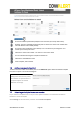
6.3
Lying Behaviour graphs for an individual cow
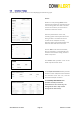
Selecting Behaviour from the activity graph page accesses a comprehensive graph for each cow
showing trend analysis over a 90 day moving window.