
User's Guide

© IceRobotics Ltd 2015 Page 15 Release 1.1 2016
6
Lying Behaviour
CowAlert allows the user to monitor the lying times of the group or herd down to individual cow
level.
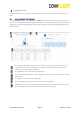
6.1
Lying Behaviour for the herd
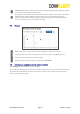
From the Navigation bar select Reports then Lying Time for the drop down menu. Herd lying time
can also be accessed from the Home page by clicking on the average lying time figure. The left hand
graph shows 7 day average lying time and the right hand graph shows herd average lying time over
the last 60 days.
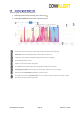
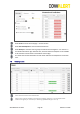
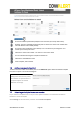
The 7 day average lying time of the herd is shown as bar charts in intervals of 2hrs. The
horizontal axis shows the average hours of lying time and the vertical axis shows the
number of cows lying within that period.
The end date for the 7 days can be changed here.
The hourly range distribution can be changed to show 1hr to 8hr groupings. 2hrs is the
default view.
The graph can be exported by clicking here.
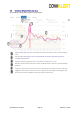
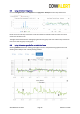
The average lying time for the herd is shown for the past 60 days.
Moving the cursor over any of the bars on the chart shows the number of animals in that
group. Clicking on any bar reflects the specific animals in that group