
User guide

Working with Proventia Manager
47
Proventia Network IPS G and GX Appliance User Guide
Working with Proventia Manager
Introduction When you open Proventia Manager, the Home page provides an immediate snapshot of
the current status of the appliance. This page includes the following navigation,
information and reporting options:
● device name (the appliance domain name you configured during setup)
● protection status
● system status
● alerts for each module
● important messages
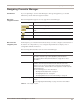
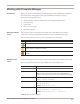
Viewing protection
status
The protection status area describes the current status of the intrusion prevention
component. Selecting a component name links you to the component status page.
The following status icons show you the current status of a component:
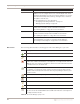
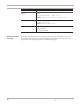
Viewing system
status
On the Home page, the system status group box describes the current status of the system.
The following table describes the data available in the System Status area:
Icon Description
Indicates that the component is active.
Indicates that the component is stopped.
Indicates that the component is in an unknown state. This status may require immediate
attention.
Table 23: Protection status icons
Statistic Description
Model Number The model number of the appliance.
Base Version Number The base version of the appliance software.
Note: The base version is the software version shipped with the
appliance, or the software version of the most recent firmware update.
Uptime How long the appliance has been online, in the following format:
x days, x hours, x minutes
Last Restart The last time the appliance was restarted, in the following format:
yyyy-mm-dd hh:mm:ss
Example:
2004-05-04 16:24:37
Last Firmware Update The last time appliance firmware was updated, in the following format:
yyyy-mm-dd hh:mm:ss - version: x.x
Example:
2004-05-04 16:25:56 - version: 1.7
Table 24: System Status statistics