® G and GX Appliances User Guide
IBM Internet Security Systems, Inc. 6303 Barfield Road Atlanta, Georgia 30328-4233 United States (404) 236-2600 http://www.iss.net Copyright © 2003, 2007 IBM Corporation. All rights reserved worldwide. Customers may make reasonable numbers of copies of this publication for internal use only. This publication may not otherwise be copied or reproduced, in whole or in part, by any other person or entity without the express prior written consent of Internet Security Systems, Inc. Patent Pending.
Contents Preface . . . . . . . . . . . . . . . . . . . . . . . . . . . . . . . . . . . . . . . . . . . . . . . . . . . . . . . . . . . . . . . . . . . 7 Overview . . . . . . . . . . . . . . . . . . . . . . . About Proventia Appliance Documentation. Conventions Used in this Guide . . . . . . . . Getting Technical Support . . . . . . . . . . . . ............................. . . . . . . . . . . . . . . . . . . . . . . . . . . . . . . . . . . . . . . . . . . . . . . . . . . . . . . . . . . . . . .
Contents Chapter 7: Configuring Responses . . . . . . . . . . . . . . . . . . . . . . . . . . . . . . . . . . . . . . . . Overview . . . . . . . . . . . . . . . . . . . . . About Responses . . . . . . . . . . . . . . . Configuring Email Responses . . . . . . . . Configuring the Log Evidence Response. Configuring Quarantine Responses . . . . Configuring SNMP Responses . . . . . . . Configuring User Specified Responses . . . . . . . . . . . . . . . . . . . . . . . . . . . . . .. .. .. .. .. .. .. . . .
Contents Chapter 13: Viewing Alerts and System Information . . . . . 141 142 145 146 147 Index . . . . . . . . . . . . . . . . . . . . . . . . . . . . . . . . . . . . . . . . . . . . . . . . . . . . . . . . . . . . . . . . . . . 149 Viewing Alerts . . . . . . . . . . Managing Saved Alert Files . Viewing Notifications Status Viewing Statistics. . . . . . . . . . . . . . . . . . . . . . . . . . . . . . . . . . . . . . . . Proventia Network IPS G and GX Appliance User Guide . . . . . . . . .
Contents 6
Preface Overview Purpose This guide is designed to help you create and maintain policies for your Proventia Network IPS G and GX appliances. It also explains how to manage these appliances using Proventia Manager software. Scope This guide describes the features in Proventia Manager and explains how to configure the appliance, configure policy settings, and manage the appliance.
Preface About Proventia Appliance Documentation Introduction This guide explains how to configure intrusion prevention, firewall settings, and other policy settings for the Proventia Network IPS appliances using Proventia Manager, the local management interface. It also provides information for managing the appliances using both the Proventia Configuration Menu and Proventia Manager.
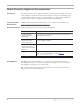
Conventions Used in this Guide Conventions Used in this Guide Introduction This topic explains the typographic conventions used in this guide to make information in procedures and commands easier to recognize. In procedures The typographic conventions used in procedures are shown in the following table: Convention What it Indicates Examples Bold An element on the graphical user interface. Type the computer’s address in the IP Address box. Select the Print check box. Click OK.
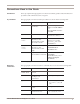
Preface Getting Technical Support Introduction ISS provides technical support through its Web site and by email or telephone. The ISS Web site The Internet Security Systems (ISS) Resource Center Web site (http://www.iss.net/ support/) provides direct access to frequently asked questions (FAQs), white papers, online user documentation, current versions listings, detailed product literature, and the Technical Support Knowledgebase (http://www.iss.net/support/knowledgebase/).
Getting Technical Support Regional Office Electronic Support Telephone Number Europe, Middle support@iss.net East, and Africa (44) (1753) 845105 Asia-Pacific, Australia, and the Philippines support@iss.net (1) (888) 447-4861 (toll free) Japan support@isskk.co.
Preface 12
Chapter 1 Introducing the Proventia Network Intrusion Prevention System Overview Introduction This chapter introduces the Proventia Network Intrusion Prevention System (IPS) and describes how its features protect the network with a minimum of configuration. It also describes other Proventia Network IPS features you can implement to customize your network’s security.
Chapter 1: Introducing the Proventia Network Intrusion Prevention System Intrusion Prevention Introduction The Proventia Network Intrusion Prevention System (IPS) automatically blocks malicious attacks while preserving network bandwidth and availability.
Intrusion Prevention ● Firewall rules You can create firewall rules that enable the appliance to block incoming packets from particular IP addresses, port numbers, protocols, or VLANs. These rules block many attacks before they affect your network. ● Automatic security content updates based on the latest security research You can automatically download and activate updated security content.
Chapter 1: Introducing the Proventia Network Intrusion Prevention System Management Features Overview You can create and deploy security policies, manage alerts, and apply updates for your appliances either locally or through a central appliance management system.
Appliance Adapter Modes Appliance Adapter Modes Introduction The inline appliances include three adapter modes as follows: ● inline protection ● inline simulation ● passive monitoring You selected one of these operation modes when you configured the appliance settings. Using the Proventia Configuration menu, if you like, you can use the default operation mode and select a different one later.
Chapter 1: Introducing the Proventia Network Intrusion Prevention System High Availability Modes Introduction The Proventia Network IPS High Availability (HA) feature enables appliances to work in an existing high availability network environment. The appliances pass all traffic between them over mirroring links, ensuring that both appliances see all of the traffic over the network and thus maintain state.
Chapter 2 Configuring Appliance Settings Overview Introduction This chapter describes how to use Proventia Setup to connect the Proventia Network IPS appliance to the network. It also outlines other appliance settings you can configure at any time, such as backup and restore settings and SNMP settings.
Chapter 2: Configuring Appliance Settings Configuration Settings Checklist Introduction Using Proventia Setup, you can configure basic network settings, as well as passwords, DNS and host name, adapter modes, port link settings, the date and time, backup and recovery settings, and SNMP configuration. You need to gather some relevant information before you begin. Checklist Use the checklist to obtain the information you need to configure the Proventia Network IPS appliance.
Using Proventia Setup Using Proventia Setup Introduction If you want to configure the appliance from a computer, follow the procedure below, which explains how to connect to the appliance using Hyperterminal. Follow the instructions listed in the documentation for your program. Establishing a serial connection to the appliance To connect to the appliance using Hyperterminal: 1. On your computer, select StartÆ ProgramsÆ AccessoriesÆ Communications. 2. Select Hyperterminal. 3.
Chapter 2: Configuring Appliance Settings 5. Follow the on-screen instructions. The following table describes the required information. Information Description Change Password • Admin Password—When you access the appliance, you must provide this password. This password can be the same as the root password. • Root Password—When you access the appliance from a command line, you must provide this password.
Using Proventia Setup Information Description Port Link Configuration Port link settings determine the appliance’s performance mode, or how the appliance handles its connection to the network. You can select the speed (the rate at which traffic passes between the appliance and the network) and the duplex mode (which direction the information flows).
Chapter 2: Configuring Appliance Settings Configuring Other Appliance Settings Introduction Through the Configuration Menu, you can view or edit the appliance settings that you configured during the initial setup. You can also manage the following important appliance settings: Select this menu option... To do this... Appliance Information View information about the appliance. Appliance Management • Back up the current configuration. • Restore current configuration or factory default.
Configuring Other Appliance Settings Item Description Netmask The subnet mask value for the network that connects to the management port. Gateway The IP address for the management gateway. Primary DNS The IP address of the primary server you use to perform domain name lookups (DNS search path). Secondary DNS The IP address of the secondary server you use to perform domain name lookups (DNS search path).
Chapter 2: Configuring Appliance Settings Network configuration From the Network Configuration Menu, you can perform the following tasks: Task Description Change IP Settings You can change the IP address, subnet mask, or gateway for the appliance. For example, you might need to change these settings if you moved the appliance to a different location or network area. Change host name settings You can change the hostname, domain name, and primary and secondary name servers for the appliance.
Configuring Other Appliance Settings Password management From the Password Management Menu, you can perform the following tasks: Task Description Change admin, root, or Proventia Manager passwords You can use Proventia Manager to also change passwords. See “Configuring User Access” on page 139. Disable the boot loader password The boot loader password protects the appliance from unauthorized user access during the boot process.
Chapter 2: Configuring Appliance Settings Reinstalling Appliance Firmware Introduction The Recovery CD included in the appliance packaging contains the software that was installed on the appliance at the factory. You can reinstall the software from this CD on the appliance. Results This process does the following: Supported network cards ● Overwrites software configuration changes you have made since you first installed the appliance.
Reinstalling Appliance Firmware Card Brand Manufacturer smc91c92_cs SMC 91c92 xirc2ps_cs Xircom CE2, CE IIps, RE-10, CEM28, CEM33, CEM56, CE3-100, CE3B, RE-100, REM10BT, REM56G-100 3c589_cs 3Com 3c589 fmvjl8x_cs FMV J181, FMV J182, TDK LAK-CD021, ConTec C-NET (PC) C, Ungermann Access/CARD pcnet_cs/NE2000 compatible cards D-Link DE-650, Linksys PCMCIA, Accton EN2212, RPTI EP400, PreMax PE-200, IBM Credit Card Adapter, Novell NE4100, Kingston KNE-PCM/x, Allied Telesis LA-PCM, ASANTE FriendlyNet T
Chapter 2: Configuring Appliance Settings 9 Description Turn off the appliance, and then connect the computer (PXE server) directly to the appliance with the provided cables. See diagram below. Connect the null modem cable to the devices as follows: • On the computer (PXE server), use the port labeled COM1. • On the appliance, use the port labeled Console. Connect the Ethernet cable to the devices as follows: • On the computer (PXE server), use the Ethernet port.
Reinstalling Appliance Firmware 5. Press the L key. The following message appears: Internet Security Systems Proventia GXxxxx Recovery Boot The PXE boot server displays status messages from the appliance, and then boots the installer over the network. 6. At the prompt, type reinstall, and then press ENTER. The installer reloads the operating system. Note: When the reinstallation is complete, the appliance automatically reboots. Let the appliance complete the boot process without interruption. 7.
Chapter 2: Configuring Appliance Settings Reconfiguring the appliance To reconfigure the appliance after you reinstall the software, follow the setup instructions in “Using Proventia Setup” on page 21. Notes: 32 ● You should complete the appliance configuration while connected to the PXE boot server. When you have completed all reinstallation and reconfiguration steps, press CTRL+G to shut down the PXE server. ● To access firmware and database updates, you must have Internet access.
Chapter 3 Configuring Appliances for High Availability Overview Introduction This chapter explains how to configure HA- capable models to work in an existing high availability network environment.
Chapter 3: Configuring Appliances for High Availability About High Availability Introduction The Proventia Network Intrusion Prevention System (IPS) High Availability (HA) feature enables appliances to work in an existing high availability network environment. The IPS passes all traffic over mirroring links, ensuring that both appliances see all traffic across the network and thus maintain state.
About High Availability Note: If you run Proventia Setup when the HA feature is enabled, you cannot modify network settings. HA and SiteProtector management You can manage HA through the SiteProtector Agent Manager. You must put both appliances in an HA configuration in the same SiteProtector group. SiteProtector can then synchronize appliance updates, including XPUs and policy updates. Each appliance reports to SiteProtector using a unique ID.
Chapter 3: Configuring Appliances for High Availability High Availability Configuration Overview Introduction Review the information in “High Availability Deployment” on page 37 before you configure the appliance. For more information on configuring your firewall policy, see “Configuring Firewall Rules” on page 114.
High Availability Deployment High Availability Deployment Introduction Logical Diagram This topic describes typical deployment scenarios for IPS in a high availability environment. It includes the following: ● a logical diagram for a standard HA deployment ● a physical network diagram for a standard deployment You can manage the HA appliance cluster from Proventia Manager. If you use SiteProtector to manage the appliances, you can manage the HA cluster from the SiteProtector Agent Manager.
Chapter 3: Configuring Appliances for High Availability Physical HA network diagram A physical network diagram of a typical HA deployment scenario is shown in Figure 3: Figure 3: HA physical network diagram 38
Chapter 4 Using Proventia Manager Overview Introduction This chapter describes how to use the local management interface to perform updates, make adjustments, and augment configuration settings.
Chapter 4: Using Proventia Manager Completing the Configuration Introduction After you have installed and configured the appliance, you can log in to Proventia Manager to complete the final configuration steps and set up appliance management. Task overview The following table outlines these steps: Step Description Where to find the procedure 1 Contact your Sales Representative for the license registration number. “Installing the license file” on page 46 Do the following: 1.
Completing the Configuration ■ applied the settings 4. Prior to using the appliance, you must install the license file.
Chapter 4: Using Proventia Manager Accessing Proventia Manager Introduction Proventia Manager is the Web-based management interface for the appliance. Use Proventia Manager to perform the following tasks: Logging on to Proventia Manager ● monitor the status of the appliance ● configure and manage settings ● view quarantine table and apply changes ● review and manage appliance activities To log on to Proventia Manager: 1. Start Internet Explorer. 2. Type https://xxx.xxx.xxx.xxx where xxx.xxx.xxx.
Navigating Proventia Manager Navigating Proventia Manager Introduction If you are planning to use Proventia Manager to manage the appliance, you should familiarize yourself with its navigation features. About the navigation buttons The following buttons appear on every page in Proventia Manager: Click this button... To do this... Access the System Logs page. Access the Alerts page for the area you have selected in the left navigation pane. Access the online Help.
Chapter 4: Using Proventia Manager This item... Lets you view or configure... System In the System area, you can configure and view information about the appliance. You can configure user access, network adapter cards, alerts, and advanced parameters to help you monitor the appliance. You can also view and download important system logs, manage licenses, and reboot the appliance from this area.
Navigating Proventia Manager Icon Description Click this icon to paste a copied item from the clipboard into a list. After you paste the item, you can edit it. If this icon appears on a page or next to a field on a page, then you must enter required data in a field, or the data you have entered in a field is invalid.
Chapter 4: Using Proventia Manager Installing the License File Introduction Proventia Network IPS appliances require a properly configured license file. If you have not installed the appropriate license file, you cannot manage the appliance. Each individual appliance requests a single license from SiteProtector. Licensing for an appliance in a high-availability configuration is identical to licensing for any other appliance. To purchase a license, contact your local sales representative.
Working with Proventia Manager Working with Proventia Manager Introduction Viewing protection status When you open Proventia Manager, the Home page provides an immediate snapshot of the current status of the appliance.
Chapter 4: Using Proventia Manager Statistic Description Last Intrusion Prevention Update The last time appliance security content was updated, in the following format: yyyy-mm-dd hh:mm:ss - version: x.x Example: 2004-01-25 12:34:36 - version: 1.
Chapter 5 Updating the Appliance Overview Introduction This chapter describes how to update the appliance using Proventia Manager. You can manually download and install firmware updates and security updates, or you can configure the appliance to automatically download and install some or all updates at designated times.
Chapter 5: Updating the Appliance Updating the Appliance Introduction Ensure the appliance is always running the latest firmware and intrusion prevention updates. The appliance retrieves updates from the ISS Download Center, accessible over the Internet. You can update the appliance in two ways: Types of updates ● configure automatic updates ● find, download, and install updates manually You can install the following updates: ● Firmware updates.
Updating the Appliance Consider using the X-Press Update Server under the following conditions: ● Large number of appliances. If you have deployed a large number of appliances, you can save bandwidth. The appliances can request updates from one Update Server, as opposed to using bandwidth to download the same updates for each appliance from the ISS Download Center. ● Locked down environment.
Chapter 5: Updating the Appliance Updating the Appliance Automatically Introduction Use the Update Settings page to configure the appliance to automatically check for and install updates.
Updating the Appliance Automatically Procedure To update the appliance automatically: 1. On the Update Settings page, complete or change the settings as indicated in the following table. Section Setting Description Automatically Check for Updates Check for updates daily or weekly If you enable this option, select the Day Of Week and Time Of Day the appliance should check for updates. Check for updates at given intervals Checks for updates several times a day.
Chapter 5: Updating the Appliance Updating the Appliance Manually Introduction Process overview You can update the appliance manually in either of the following circumstances: ● you have not configured automatic updates for the appliance ● you want to install an available update off-schedule You must complete the following tasks to update the appliance manually: ● locate and download available updates ● install the updates Note: When you install a firmware update, the appliance may lose link temp
Using Update Tools Using Update Tools Introduction Use the Update Tools page to find updates or to roll back an update. A rollback removes the last update installed on the appliance. Important: You cannot roll back firmware updates. Cumulative updates and rollbacks XPU updates are cumulative. Example The following example describes how the appliance behaves when rolling back cumulative updates: If you install security update 1.81 but do not install version 1.82, and then you install version 1.
Chapter 5: Updating the Appliance Using Advanced Parameters to Tune Update Settings Introduction Use the Advanced Parameters tab on the Update Settings page to tune the update settings. About advanced parameters Advanced parameters are composed of name/value pairs. Each name/value pair has a default value. For example, the parameter np.firewall.log is a parameter that determines whether to log the details of packets that match firewall rules you have enabled. The default value for this parameter is on.
Using Advanced Parameters to Tune Update Settings Parameter Type Default Value Description Update.proxy.port number none Specifies the port number of the HTTP proxy server for connecting to the Update Server. Update.source.url string https://www.iss.net/ XPU Specifies the address of the Update Server. If the appliance is not connected to the Internet, use https// ::3994/xpu (Name is case sensitive.) Update.proxy.
Chapter 5: Updating the Appliance Working with advanced parameters To edit, copy, or remove update advanced parameters: 1. Select Update Settings. 2. Select the Advanced Parameters tab, and then do one of the following: If you want to... Then... Edit Tip: You can edit some properties directly on the Advanced Parameters tab by double-clicking the item you want to configure. 1. Select the parameter, and then click the Edit icon. 2. Select or clear the Enabled check box. 3.
Chapter 6 Managing the Appliance through SiteProtector Overview Introduction This chapter describes how to set up the appliance so you can manage it through the SiteProtector Console.
Chapter 6: Managing the Appliance through SiteProtector Managing with SiteProtector Introduction SiteProtector is the IBM ISS management console. With SiteProtector, you can manage components and appliances, monitor events, and schedule reports. By default, your appliance is set up for you to manage it through Proventia Manager. If you are managing a group of appliances along with other sensors, you may prefer the centralized management capabilities that SiteProtector provides.
Managing with SiteProtector When the Agent Manager receives the heartbeat, it places the appliance in the group you specified when you set up registration. If you did not specify a group, it places the appliance in the default group “G-Series” or “Network IPS,” depending on your version of SiteProtector. If you clear the group box when you register the appliance, it places the appliance in Ungrouped Assets.
Chapter 6: Managing the Appliance through SiteProtector Configuring SiteProtector Management Introduction Enabling SiteProtector management automatically does the following: ● Registers the appliance with SiteProtector ● Places the appliance in a specified SiteProtector group ● Directs the appliance to report to a specified Agent Manager Use the Management page in Proventia Manager to set up and enable SiteProtector management for the appliance.
Configuring SiteProtector Management Setting Description Desired SiteProtector Group for Sensor Type the name of the SiteProtector group to which the appliance should be assigned. If you do not specify a group, then the appliance is added to the default “G-Series” or “Network IPS” group. Important: You must assign the appliance to a group that contains only other Proventia Network IPS or G-Series appliances.
Chapter 6: Managing the Appliance through SiteProtector Verifying successful registration To verify that the appliance registered successfully with SiteProtector: 1. Open the SiteProtector Console. 2. In the left pane, select the group to which you added the appliance. Note: If you did not specify a group when you registered appliance, it appears in the default group "G-Series" or “Network IPS,” depending on your version of SiteProtector.
Navigating SiteProtector Navigating SiteProtector Introduction If you are planning to use SiteProtector to manage the appliance, you should familiarize yourself with the navigation features that allow you to create, manage, and view the appliance’s current IPS policies. For general information about navigating the SiteProtector Console, see the SiteProtector Help. About policies and settings You can configure the following appliance policies and settings in SiteProtector: Select this item...
Chapter 6: Managing the Appliance through SiteProtector Icon Description Click this icon to remove an item (or items) from the list. You can use the standard SHIFT+click or CTRL+click methods to select adjacent or non-adjacent items in the list. Note: When you click Remove, an item may not be removed from the list; instead, it is disabled and reset to its default state. Click this icon to group items by column in a table. For example, you could group security events by severity.
Chapter 7 Configuring Responses Overview Introduction This chapter describes how to configure responses for the appliance. Responses control how the appliance reacts when it detects an intrusion or other important events on the network.
Chapter 7: Configuring Responses About Responses Introduction Your response policy controls how the appliance responds when it detects intrusions or other important events. You create responses and then apply them to events as necessary. You can configure the following response types: Block response ● Email. Send email alerts to an individual address or email group. ● Log Evidence. Log alert information to a saved file. ● Quarantine. Quarantine the attack. ● SNMP.
Configuring Email Responses Configuring Email Responses Introduction You can configure email notifications to alert individuals or groups when specific events occur. You can also select the event parameters to include in the message to provide important information about detected events. Adding email responses To add or change email responses: 1. Do one of the following: ■ In Proventia Manager, select Responses. ■ In SiteProtector, select Response Objects. 2. Select the Email tab. 3. Click Add. 4.
Chapter 7: Configuring Responses Working with email responses To edit, copy, or remove email responses: 1. Do one of the following: ■ In Proventia Manager, select Responses. ■ In SiteProtector, select Response Objects. 2. Select the Email tab, and then do one of the following: If you want to... Then... Edit Tip: You can edit some properties directly on the Email tab by double-clicking the item you want to configure. 1. Select the response, and then click the Edit icon. 2.
Configuring the Log Evidence Response Configuring the Log Evidence Response Introduction You can configure the appliance to log the summary of an event. The Log Evidence response creates a copy of the packet that triggers an event and also records information that identifies the packet, such as Event Name, Event Date and Time, and Event ID. Evidence logs show you what an intruder did or tried to do to the network. The appliance logs packets that trigger events to the /var/iss/ directory.
Chapter 7: Configuring Responses Configuring Quarantine Responses Introduction You can create quarantine responses that block intruders when the appliance detects security, connection, or user-defined events. These responses also block worms and trojans. Quarantine responses work only when you have configured the appliance to run in Inline Protection mode. Note: The Quarantined Intrusions page shows rules dynamically generated in response to detected intruder events.
Configuring SNMP Responses Configuring SNMP Responses Introduction You can configure Simple Network Management Protocol (SNMP) notification responses for connection, security, and user-defined events that pull certain values and send them to an SNMP manager. How SNMP works Simple Network Management Protocol (SNMP) is a set of protocols used for managing networks.
Chapter 7: Configuring Responses Working with SNMP responses To edit, copy, or remove SNMP responses: 1. Do one of the following: ■ In Proventia Manager, select Responses. ■ In SiteProtector, select Response Objects. 2. Select the SNMP tab. 3. Do one of the following: If you want to... Then... Edit Tip: You can edit some properties directly on the SNMP tab by double-clicking the item you want to configure. 1. Select the response, and then click the Edit icon. 2.
Configuring User Specified Responses Configuring User Specified Responses Introduction You can configure user-specified responses to events, such as executing an application or script. Using executables or shell scripts For user-specified responses, you can use a Linux binary or shell script, including any command-line options or arguments (such as event name or source address). After you create the response, you must manually copy the executable to the appliance.
Chapter 7: Configuring Responses 3. Do one of the following: If you want to... Then... Edit Tip: You can edit some properties directly on the User Specified tab by double-clicking the item you want to configure. 1. Select the response, and then click the Edit icon. 2. Select or clear the Enabled check box. 3. Edit the response, and then click OK. Copy 1. Select the response, and then click the 2. Click the Copy icon. Paste icon. 3. Edit the response as needed, and then click OK. Remove 1.
Chapter 8 Working with Security Events Overview Introduction This chapter describes how to configure security events and response filters. These help you create a security policy that determines how the appliance responds to and reports security events that occur on the network.
Chapter 8: Working with Security Events Configuring Protection Domains Introduction Protection domains let you define security policies for different network segments monitored by a single appliance. Protection domains act like virtual sensors, as though you had several appliances monitoring the network. You can define protection domains by ports, VLANs, or IP address ranges.
Configuring Protection Domains Setting Description Adapter Select an appliance monitoring adapter or a list of monitoring adapters. Note: The appliance ignores port configurations that do not apply to the specific appliance. For example, the appliance may only allow you to configure two adapter ports if it only has two ports, even though there are additional ports available for configuration. VLAN Range Type the range of virtual LAN tags or leave blank.
Chapter 8: Working with Security Events Configuring Security Events Introduction The Security Events page lists hundreds of attacks, audits, and security events. A security event is network traffic with content that can indicate an attack or other suspicious activity. These events are triggered when the network traffic matches one of the events in the active security policy, which you can edit to meet the network’s needs.
Configuring Security Events Setting Description Display Select how you want to display the event in the management console: • No Display. Does not display the detected event. • WithoutRaw. Logs a summary of the event. • WithRaw. Logs a summary and the associated packet capture. Block Select this check box to block the attack by dropping packets and sending resets to TCP connections.
Chapter 8: Working with Security Events Working with security events To edit, copy, or remove security events: 1. Select Security Events. 2. Select the Security Events tab, and then do one of the following: If you want to... Then... Edit Tip: You can edit some properties directly on the Security Events tab by double-clicking the item you want to configure. 1. Select the event, and then click the Edit icon. 2. Select or clear the Enabled check box. 3. Edit the event, and then click OK.
Assigning Multiple Security Events to a Protection Domain Assigning Multiple Security Events to a Protection Domain Introduction Once you have configured the protection domains, you can assign multiple security events to them. The saves you time when you are configuring the security policy for each protection domain on the network. Procedure To assign a multiple security events to a protection domain: 1. Select Security Events. 2.
Chapter 8: Working with Security Events Viewing Security Event Information Introduction The Security Events tab lists hundreds of attacks, audits, and security events. You can customize how events appear to make viewing and searching easier. About filters and regular expressions Security events filters use regular expressions to limit the number of events displayed.
Viewing Security Event Information 5. Click OK. 6. Collapse or expand the groups on the Security Events tab to view events. 7. Save your changes. Viewing security events To filter security events: 1. Select Security Events. 2. On the Security Events tab, select the Filter check box to enable filtering. 3. Click Filter. 4. In the Regular Expressions area, type the regular expression by which you want to filter. This search feature is not case-sensitive.
Chapter 8: Working with Security Events Configuring Response Filters Introduction A response filter lets you refine the security policy by controlling the number of events to which the appliance responds and the number of events reported to the management console.
Configuring Response Filters 4. Complete or change the settings as indicated in the following table. Setting Description Enabled The filter is enabled by default. To disable the filter, clear the check box. Protection Domain Select the protection domain for which you want to set this filter. Note: For a response filter to be active, the corresponding security event must be enabled for the protection domain you specify here. Event Name Displays a truncated event name. Click the button to add events.
Chapter 8: Working with Security Events Setting Description Responses To enable responses, select one of the following tabs: • Email. Select an email response from the list. • Quarantine. Select one or more check boxes to enable quarantine responses. • SNMP. Select an SNMP response from the list. • User Defined. Select one or more check boxes to enable userdefined responses. Note: Click Edit to change the properties of any response in the list.
Configuring Response Filters Changing the order of response filters To change the order of response filters: 1. Select Security Events. 2. Select the Response Filters tab. 3. Select an entry, and then click the Up or Down icons to move the filter. 4. Save your changes. Working with response filters To edit, copy, or remove response filters: 1. Select Security Events. 2. Select the Response Filters tab, and then do one of the following: If you want to... Then...
Chapter 8: Working with Security Events Viewing Response Filter Information Introduction The Response Filters tab lists response filters you have defined to control how security events are reported to the management console. Selecting columns to display To select columns to display: 1. Select Security Events. 2. Select the Response Filters tab. 3. Click Select Columns. 4. Select the check box next to the columns that you want to appear on the tab. 5. Click OK. 6. Save your changes.
Chapter 9 Configuring Other Intrusion Prevention Settings Overview Introduction This chapter describes how to configure and manage other intrusion prevention settings, such as user-defined events, connection events, and OpenSignature events. It also discusses how to manage quarantined intrusions, view global tuning parameters for the appliance, and monitor X-Force blocking.
Chapter 9: Configuring Other Intrusion Prevention Settings Managing Quarantined Intrusions Introduction The Quarantined Intrusions page shows quarantine rules dynamically generated in response to detected intruder events. When quarantine response is enabled, the rules specify the packets to block and the length of time to block them. They prevent worms from spreading, and deny access to systems infected with backdoors or trojans.
Configuring Connection Events Configuring Connection Events Introduction Connection events are user-defined notifications of open connections to or from particular addresses or ports. They are generated when the appliance detects network activity at a designated port, regardless of the type of activity, or the content of network packets exchanged. The Connection Events page lists pre-defined connection events for different connection types, such as WWW, FTP, or IRC.
Chapter 9: Configuring Other Intrusion Prevention Settings Setting Description Comment Type a unique description for the event. Severity Select a severity level for the event: Low, Medium, or High. Event Throttling Type an interval value in seconds. At most, one event that matches an attack is reported during the interval you specify. A value of 0 (zero) disables event throttling. Protocol Type the protocol for the event.
Configuring Connection Events 4. As needed, complete the following Response settings as indicated in the following table. Click Edit to change the properties of a response in the list. For more information, see “Configuring Responses” on page 67. Response Description Email Select an email response from the list. Quarantine Select one or more check boxes to enable quarantine responses. SNMP Select an SNMP response from the list.
Chapter 9: Configuring Other Intrusion Prevention Settings 96
Configuring User-Defined Events Configuring User-Defined Events Introduction Enabled events in a policy determine what an appliance detects. You create user-defined events around contexts, which basically specify the type and part of a network packet you want the appliance to scan for events. About the global protection domain Notice that all events are listed under the global protection domain.
Chapter 9: Configuring Other Intrusion Prevention Settings Setting Description Context Select the type and part of the network packet that the appliance should scan. For more information, see “User-Defined Event Contexts” on page 100. Search String Type the text string in the packet (context) that determines whether an event matches this signature. You can use wildcards and other expressions in strings. For more information, see “Regular Expressions in User-Defined Events” on page 105.
Configuring User-Defined Events Working with userdefined events To edit, copy, or remove user-defined events: 1. On the User Defined Events page, do one of the following: If you want to... Then... Edit Tip: You can edit some properties directly on the User Defined Events page by double-clicking the item you want to configure. 1. Select the event, and then click the Edit icon. 2. Select or clear the Enabled check box. 3. Edit the event, and then click OK. Copy 1.
Chapter 9: Configuring Other Intrusion Prevention Settings User-Defined Event Contexts Introduction When you create a user-defined event signature, you select a context that tells the appliance the type and particular part of a network packet to monitor for events. After you specify the context, you add a string that tells the appliance exactly what to look for when it scans the packet. See “Regular Expressions in User-Defined Events” on page 105 for more information.
User-Defined Event Contexts Email_Sender context Use the Email_Sender context to monitor incoming or outgoing email from a particular recipient. ● Monitors The Email_Sender context monitors the sender address part of the email header using the SMTP, POP, IMAP protocols. When the appliance detects an event that matches a signature using the Email_Sender context, you can examine the details of the event to determine which protocol the email used.
Chapter 9: Configuring Other Intrusion Prevention Settings News_Group context Use the News_Group context to monitor the names of news groups that people at your company access. ● Monitors The News_Group context monitors people accessing news groups using the NNTP protocol. ● Example You can use the context to detect subscriptions to news groups, such as hacker or pornography groups, that are inappropriate according to your company’s Internet usage policy.
User-Defined Event Contexts SNMP_Community context Use the SNMP_Community context to monitor the use and possible abuse of SMNP community strings. ● Monitors The SNMP_Community context monitors any packet containing an SNMP community string. An SNMP community string is a clear text password in an SNMP message. This password authenticates each message. If the password is not a valid community name, then the message is rejected.
Chapter 9: Configuring Other Intrusion Prevention Settings You could also use this context to generically search whether employees using computers to access company-banned sites, such as pornography sites. User_Login_Name context Use the User_Login_Name context to detect user names exposed in plain text during authentication requests. This context works for many protocols, so you can use it to track attempts to use a particular account no matter what protocol the attacker uses.
Regular Expressions in User-Defined Events Regular Expressions in User-Defined Events Introduction Regular expressions (strings) are a combination of static text and variables the appliance uses to detect patterns in the contexts (network packets) you specify for user-defined event signatures. Use regular expressions when you create user-defined event signatures if you need the appliance to detect more than a single static text string.
Chapter 9: Configuring Other Intrusion Prevention Settings Meta-Character Description \xhhh matches the specified hexidecimal character code .
Viewing User Defined Event Information Viewing User Defined Event Information Introduction The User Defined Events page displays all of the custom event signatures you have created for the appliance. You can control how user-defined events appear in this view, to make managing and searching events easier. Selecting columns to display To select columns to display: 1. On the User Defined Events page, click Select Columns. 2. Select the check box next to the columns that you want to appear. 3. Click OK.
Chapter 9: Configuring Other Intrusion Prevention Settings Configuring OpenSignature Introduction OpenSignature (formerly Trons) uses a flexible rules language to allow you to write customized, pattern-matching IDS signatures to detect specific threats that are not already preemptively covered in IPS products. This feature is integrated into the ISS Protocol Analysis Module (PAM) as a rule interpreter. Risks associated with OpenSignature The capabilities of custom signature development are very broad.
Configuring OpenSignature Enabling the OpenSignature Parser To enable the OpenSignature Parser: 1. Select Global Tuning Parameters. 2. On the Tuning Parameters tab, click Add. 3. Complete the settings as indicated in the following table: Setting Name Description Type the following to enable OpenSignature: engine.opensignature.enabled Value Type the following: true 4. Save your changes. Adding or changing rules To add or change rules: 1.
Chapter 9: Configuring Other Intrusion Prevention Settings Configuring Global Tuning Parameters Introduction Global tuning parameters affect intrusion prevention settings at the group and site levels. Use Global Tuning Parameters to configure (or tune) certain parameters and apply them globally to a group of appliances to better meet your security needs or enhance the performance of the hardware.
Configuring Global Tuning Parameters Adding tuning parameters To add tuning parameters: 1. Select Global Tuning Parameters. 2. On the Tuning Parameters tab, click Add. 3. Complete the settings as indicated in the following table. Setting Name Description Type a name for the parameter. Example: np.log.count Value Comment Type a value according to the value type associated with the parameter: • Boolean. Select a value of True or False. • Number. Enter the appropriate number for the parameter.
Chapter 9: Configuring Other Intrusion Prevention Settings Configuring X-Force Default Blocking Introduction When you use X-Force Default Blocking, the block response is enabled automatically for events (or signatures) that X-Force recommends. Procedure To configure default blocking: 1. Select Global Tuning Parameters. 2. Select the X-Force Default Blocking tab. 3. X-Force blocking is enabled by default. To disable it, clear the Use X-Force blocking recommendations box. 4. Save your changes.
Chapter 10 Configuring Firewall Settings Overview Introduction Using rule statements, you can configure firewall rules to block attacks based on various source and destination information in the packet. In addition, you can filter out traffic you do not want to have inspected if you are not interested in seeing it.
Chapter 10: Configuring Firewall Settings Configuring Firewall Rules Introduction You can add firewall rules to block unwanted traffic before they enter the network. You can manually add firewall rules, or you can enable the appliance to construct rules using the values you specify. This offers you greater flexibility when configuring firewall settings. Important: Firewall rules only work when the appliance is set to inline modes.
Configuring Firewall Rules Firewall rules and actions The firewall supports several different actions that describe how the firewall reacts to the packets matched in the rules, or statements. The following Table 34defines these actions: Rule Description Ignore (Permit) Allows the matching packet to pass through, so that no further actions or responses are taken on the packet. Protect Packets that match this rule are processed by PAM.
Chapter 10: Configuring Firewall Settings Setting Description Protocol Select a protocol from the list. If you select Any as the protocol for a rule, the following criteria is applied if the following conditions are met: • If you set an ICMP code, then an ICMP clause is added to the rule. • If you set a source or destination port, then both a UDP and a TCP clause are added to the rule. • If you set a Protocol Number greater than zero (0), then a protocol number clause is added to the rule.
Firewall Rules Language Firewall Rules Language Introduction A firewall rule consists of several statements (or clauses) that define the traffic for which the rule applies. When you manually create firewall rules for the appliance to use, you can use the syntax listed in this topic. Firewall clauses A firewall rule consists of several clauses chained together to match specific criteria for each packet. The clauses represent specific layers in the protocol stack.
Chapter 10: Configuring Firewall Settings type. The fifth statement is a combination of the first and second statements. The sixth statement is a combination of the first, second, and fourth statements. 1. 2. 3. 4. 5. 6. ip ip ip ip ip ip src addr dst addr addr proto src addr dst addr src addr dst addr proto Examples ip addr 192.168.10.1/24 ip addr 192.168.10.0-192.168.10.
Firewall Rules Language IPv4 address expression examples The can be either hex or decimal number in a range from 0 to 255. All hex numbers must have a 0x prefix. The following table lists examples. Example Description n.n.n.n Single address n.n.n.n, n.n.n.n Address list n.n.n.n/ Specific address using CIDR format; netmask value must range from 1 to 32 n.n.n.n - n.n.n.
Chapter 10: Configuring Firewall Settings Tuning Firewall Logging Introduction Using Local Advanced Parameters, you can tune the way firewall logging behaves for the appliance. You can specify values such as the number of firewall logs, the log name, or the maximum log size. Firewall logging parameters You can edit the following firewall logging parameters: Name Description Values np.firewall.log Determines whether to log the details of packets that match firewall rules that are enabled.
Chapter 11 Configuring Local Tuning Parameters Overview Introduction Local tuning parameters affect intrusion prevention settings at the device level for individual appliances. This chapter describes how to configure local tuning parameters for the appliance, such as the alert queue, the network card adapter properties, and advanced parameters.
Chapter 11: Configuring Local Tuning Parameters Configuring Alerts Introduction You can configure alert messages that notify you about appliance-related events. You can also determine what action the appliance should take when an event causes an alert, such as sending an email to the appliance administrator, or running an executable in response to the event. Alert types You can enable three types of sensor event alerts: System alerts and SNMP ● Error.
Configuring Alerts Procedure To configure an alert: 1. Select Local Tuning Parameters. 2. Select the Alerts tab. 3. In the area for the alert type (Sensor Error, Warning, Informative) to configure, select the Enable check box. 4. Select a Priority for the alert: Low, Medium, or High. 5. Select the Display on console check box to enable the alert to appear in the console. Note: In Proventia Manager, alerts appear on the Alerts tab. In SiteProtector, alerts appear on the Analysis tab in the Console. 6.
Chapter 11: Configuring Local Tuning Parameters Setting Description Configure Email Click Add, and then specify the following: • Name. Type a meaningful name. • SMTP Host. Type the mail server (as a fully qualified domain name or IP address). Note: The SMTP Host must be accessible to the appliance to send email notifications. • From. Type individual or group email address(es). Separate addresses with commas. • To. Type individual recipient or email group(s). Separate addresses with commas.
Managing Network Adapter Cards Managing Network Adapter Cards Introduction You can view and manage settings for the appliance's network adapter cards. Important: If you change any settings on this page, the appliance may lose link temporarily. About high availability mode The Proventia Network IPS High Availability (HA) feature enables the appliances to work in an existing high availability network environment.
Chapter 11: Configuring Local Tuning Parameters 6. For the Port/Duplex Speed Settings, select the method the network adapter should use to determine link speed and mode. Method Description Auto or Auto Negotiate Allows two interfaces on a link to select the best common mode automatically, the moment a cable is connected.
Managing Network Adapter Cards 9. In the Adapter Mode (Non HA) list, select the appliance mode. Important: If you change an appliance’s monitoring mode from Simulation to Protection, the following Advanced Parameters are enabled by default: - np.drop.invalid.checksum - np.drop.invalid.protocol 10. Select a Fail Mode for the appliance. Important: The GX4000 series appliances fail open by default; the GX5000 and GX6000 series appliances fail closed by default. You cannot change these modes. 11. Click OK.
Chapter 11: Configuring Local Tuning Parameters Managing the Alert Queue Introduction The appliance uses a queue file named SensorEventQueue.adf to store event alerts. Use the Alert Queue page to determine how large this file can become before alerts are lost and how the queue file handles alerts after the maximum file size is reached. Important: If you change any settings on this page, the appliance may lose link temporarily.
Configuring Advanced Parameters Configuring Advanced Parameters Introduction You can use the Advanced Parameters tab to configure (or tune) certain parameters for a specific appliance to better meet your security needs or enhance the performance of the hardware.
Chapter 11: Configuring Local Tuning Parameters Name Type Default Value Description engine.adapter.low-water.default number 1 The minimum number of packets per traffic sampling interval that are expected to flow on each adapter. The lowwater mark is used as the threshold to issue Network_Quiet and Network_Normal audit events. engine.droplog.enabled boolean false Determines whether logging of dropped packets is enabled. engine.droplog.
Configuring Advanced Parameters Name Type Default Value Description np.drop.rogue.tcp.packets string false Determines whether to block packets that are not part of a known TCP connection in inline protection mode. np.firewall.log string on Determines whether to log the details of packets that match firewall rules that are enabled. np.log.quarantine.added string on Logs the details of rules that are added to the quarantine table. np.log.quarantine.
Chapter 11: Configuring Local Tuning Parameters Adding advanced parameters To add advanced parameters: 1. Select Local Tuning Parameters. 2. Select the Advanced Parameters tab. 3. Click Add. 4. Complete the settings as indicated in the following table. Setting Description Enabled Select this check box to enable the parameter. Name Type a name for the parameter. Example: engine.log.file Comment Type a unique description for the parameter. Example: The engine log file.
Configuring TCPReset Configuring TCPReset Introduction You can use the appliance to monitor (read-only) SPAN ports on network equipment. To monitor (read-only) SPAN ports, you must configure the appliance’s TCPReset (kill) port. If using (read-only) monitoring ports, the appliance must send TCP Resets on another interface. Note: The appliance is configured by default to send TCP Resets through the monitoring ports even in passive monitoring mode.
Chapter 11: Configuring Local Tuning Parameters Increasing Maximum Network Frame Size Introduction By default, the Proventia Network IPS GX5000 series appliances support a maximum network frame size of 9216 bytes, including the Ethernet FCS (Frame Check Sequence). Ordinary Ethernet (and, in particular, IEEE 802.3 standard) frames are limited to 1518 bytes. Certain types of network equipment support "jumbo" frames; generally, any frame larger than 1518 bytes is considered a jumbo frame.
Chapter 12 Managing System Settings Overview Introduction This chapter explains how to view system status and how to change system settings and properties. Use Proventia Manager to complete the procedures in this chapter. Even if you are managing the appliance through SiteProtector, you must use Proventia Manager to configure these local settings.
Chapter 12: Managing System Settings Viewing System Status Introduction Review system status information occasionally to ensure the appliance is not overwhelmed by network traffic. System settings can also help you detect any sudden changes in memory or CPU usage. Procedure To view system status: 1. In the navigation pane, select System. The following system information appears: Table Statistic Description Memory Usage Total Memory Amount of memory installed on the appliance.
Managing Log Files Managing Log Files Introduction The Log Files page in Proventia Manager displays all the log files associated with the appliance. Use this page to view, download, or delete system logs. About timestamps in log files Timestamps in some log files are stored in Unix time (the number of seconds elapsed since 00:00:00 on January 1, 1970 UTC). You can use a tool called logtime to translate these timestamps to local time. Important: You must perform this operation on the appliance itself.
Chapter 12: Managing System Settings Working with System Tools Introduction Use the System Tools page to perform basic system tasks, such as the following: ● handling problems with the appliance management port ● testing whether the appliance is communicating correctly with SiteProtector ● testing whether the appliance can communicate with configured SNMP trap receivers, email servers, or NTP servers Important: You can only perform these tasks in Proventia Manager.
Configuring User Access Configuring User Access Introduction You can change the following passwords in the Proventia Manager interface: ● root password for the command line ● administrative password for the Proventia appliance ● Web administrative password for Proventia Manager Important: Record and protect your passwords. If you lose a password, you must reinstall the appliance and reconfigure the network settings. You can also enable or disable the bootloader (root) password.
Chapter 12: Managing System Settings Installing and Viewing Current Licenses Introduction The appliance must have a valid license key to apply updates. Use the Licensing page to view important information about the current status of the license file, including expiration dates, and to enter new license key files. Each license key file you install is unique to the product license and may require that you provide IP address range information specific to the network.
Chapter 13 Viewing Alerts and System Information Introduction This chapter describes how to view system alerts, events, logs, and statistics in Proventia Manager.
Chapter 13: Viewing Alerts and System Information Viewing Alerts Introduction Use the Alerts page in Proventia Manager to view and manage system- and securityrelated alerts. The alerts list contains the following alert types: ● intrusion prevention alerts are related to attempted attacks that occur in the network ● system alerts are related the appliance and its operation Reference: See “Configuring Alerts” on page 122 for more information about creating alerts to display in the management console.
Viewing Alerts 2. To view an alert's details, click the Alert Name. Tip: To view the previous or next alert's details, click the UP or DOWN arrows. 3. To refresh the view, from the Refresh Data list, select one of the following: ■ To refresh the list immediately, select Refresh Now. ■ To refresh the list automatically, select the time interval. Tip: Select Auto Off to turn off automatic refresh. If you select this option, you must manually refresh the page to view the latest alerts.
Chapter 13: Viewing Alerts and System Information Saving the alerts list To save the alerts list: 1. Do one of the following: ■ Click the Alerts button. ■ Select one of the following: NotificationsÆAlerts Intrusion PreventionÆAlerts SystemÆAlerts 2. On the Alerts tab, click Save alerts list to file. 3. Select the log where you want to save the information, and then click Download. 4. On the File Download dialog box, click Save. 5.
Managing Saved Alert Files Managing Saved Alert Files Introduction Use the Log File Management page in Proventia Manager to view and manage saved alerts files by either downloading the files to another system, deleting the files, or by doing both. After you download files to another system, the saved file still exists on the appliance. Downloading alert files To download alert files: 1. Do one of the following: ■ Click the Alerts button.
Chapter 13: Viewing Alerts and System Information Viewing Notifications Status Introduction The Notifications Status area provides valuable information about actions taking place on the appliance. You can view or change the following: Viewing alert log event data ● Alert log event data ● System logs Use the Alert Event Log information on the Notifications Status page to monitor the size and number of your event logs. Monitoring this information will help you effectively manage system and event data.
Viewing Statistics Viewing Statistics Introduction Use the Statistics page to view the statistics of network traffic processed by the appliance. You can use these statistics for testing purposes, troubleshooting, or some type of auditing to discover network data and attack trends. Viewing statistics To view the statistics: 1. On the Proventia Manager navigation pane, select Statistics. 2.
Chapter 13: Viewing Alerts and System Information Packets Description Unanalyzed Packets The number of packets forwarded or dropped without analysis since the adapter instance was created. Unanalyzed packets are processed by the driver whenever the application cannot process them as quickly as they are being received.
Index a adapter clause 117 adapter modes inline protection 17 inline simulation 17 network adapter cards 127 passive monitoring 17 settings 23 admin password 27 advanced parameters updates 56 agent name 25 status 25 agent management 25 agent name 25 agent status 25 Agent Manager 60, 63 agent name 22, 24 alert queue 128 alerts 122, 142 alert list 142 alert queue 128 error 122 filters 143 hardware 122 informative 122 log event data 146 saved files 145 SNMP 122 warning 122 appliance adapter modes 17 alerts 142
Index c connection events 93 contexts DNS_Query 100 conventions, typographical in commands 9 in procedures 9 in this manual 9 CPU usage 136 d date/time 22 DNS primary 25 secondary 25 DNS_Query context 100 documentation 8 driver packets 147 dropped 147 forwarded packets 147 injected 147 received packets 147 transmitted packets 147 unanalyzed 148 driver statistics.
Index high availability (HA) (cont’d) network adapter cards 125, 127 overview 36 primary/secondary configurations 34 SiteProtector management 35 support 34 Home page 47 host configuration 22 host name 24, 26 Hyperterminal 21 i ICMP conditions 118 ICMP traceroute protocol 138 Ignore response 68 injected packets 147 inline protection high availability (HA) 18 inline protection mode 17 inline simulation high availability (HA) 18 inline simulation mode 17 Internet Security Systems technical support 10 Web sit
Index network time protocol (NTP) News_Group context 102 notifications 146 26 o OpenSignature 108 parser 109 risks 108 syntax 108 p packet analysis statistics 147 parameters common tuning 129 firewall logging 120 global tuning 110 local tuning 129 passive monitoring mode 17 Password context 102 password management 27 admin password 27 bootloader password 27 Proventia Manager 27 root password 27 passwords 22, 139 admin 27 bootloader 27, 139 Proventia Manager 27 root 27 ping 138 policies security 77 port
Index SiteProtector (cont’d) supported versions 7 updates 61 SNMP alerts 122 ISS MIB file 73 responses 73 SNMP configuration 27 SNMP daemon 27 SNMP management trap receivers 27 SNMP responses 73 SNMP_Community context statistics 147 network 147 packet analysis 147 protection 147 status notifications 146 system 136 system logs 146 system messages 48 system status 47, 136 CPU usage 136 memory usage 136 system tools 138 ping 138 reboot 138 shut down 138 traceroute utility 138 responses 68 Block 68 email 69 I
Index traffic processes drop 126 forward 126 transmitted packets 147 trap receivers 27 tuning parameters global 110 typographical conventions 9 user-defined events 97 columns 107 event contexts 100 filters 107 global protection domain 97 group by 107 protection domains 97 regular expressions 105 u v UDP traceroute protocol 138 unanalyzed packets 148 update settings 53 update tools 55 updates 50 advanced parameters 56 automatic 52 available downloads 54 cumulative 55 firmware 50 intrusion prevention 50
Internet Security Systems, Inc., an IBM Company Software License Agreement BY INSTALLING, ACTIVATING, COPYING OR OTHERWISE USING THIS SOFTWARE PRODUCT, YOU AGREE TO ALL OF THE PROVISIONS OF THIS ISS SOFTWARE LICENSE AGREEMENT ("LICENSE").
ANY OTHER PERSON FOR DAMAGES, DIRECT OR INDIRECT, OF ANY NATURE, OR EXPENSES INCURRED BY LICENSEE. LICENSEE'S SOLE AND EXCLUSIVE REMEDY SHALL BE TO TERMINATE THE BETA PRODUCT LICENSE BY WRITTEN NOTICE TO ISS. 5. Evaluation License - If ISS is providing Licensee with the Software, security content and related documentation on an evaluation trial basis at no cost, such license Term is 30 days from installation, unless a longer period is agreed to in writing by ISS.
injury, or severe physical or property damage. ISS disclaims any implied warranty of fitness for High Risk Use. Licensee accepts the risk associated with the foregoing disclaimers and hereby waives all rights, remedies, and causes of action against ISS and releases ISS from all liabilities arising therefrom. 17. Confidentiality - "Confidential Information" means all information proprietary to a party or its suppliers that is marked as confidential.