
User's Manual


30
Chapter 5
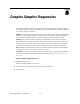
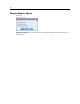
Figure 5-1
Freq uencies dialog box
E Select at least one frequency variable.
Optionally, you can specify variables to define subpopulations. Statistics are computed separately
for each subpopulation.
Complex Samples Frequencies Statistics
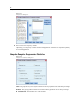
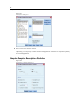
Figure 5-2
Frequencies Statistics dialog box
Cells. This group allows you to request estimates of the cell population sizes and table percentages.
Statistics. This group produces statistics associated with the population size or table percentage.
Standard error. The standard error of the estimate.