
User's Manual

212
Chapter 11
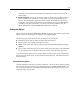
File type. Available file types are:
HTML document. The report is saved as a single HTML fil e. If your rep ort contains graphs,
they ar e saved as PNG files and are referenced by the HTML file. When publish ing your
report on the Internet, make su r e to upload both the HTML file and any images it refer ences.
Text documen
t. The report is saved as a single text file. If y our report contains graphs, only
the filename and path references are included in the report.
Microsoft Word document. The report is saved as a single document, with any graphs
embedd ed directly int o the document.
Microsoft Excel document. The report is save d as a single spreadsheet, with any graphs
embedd ed directly into the spreadsheet.
Microsoft P
owerPoint document. Each phase is shown on a new slide. Any graphs are
embedd ed directly into the PowerPoint slides.
Output object. When opened in SPSS Modeler, this file (.cou) is the same as the
Output to
screen option in the Report Format group.
Note: To export to a Microsoft Office file, you must have the corresponding application installed.
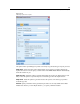
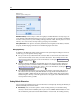
Title. Specify a title for the report.
Report structure. Select either
CRISP-DM or Classes. CRISP-DM view provides a st atus report
with “big-picture” synop ses as w ell as de tails about each phase of data mining. Classes view is an
object-bas ed view t ha t is more appropriate for inter nal tracking of data and streams.
Author. The default user name is displa ye d, but you can change it.
Report includes. Select a method for including objects in the report. Select
all folders and objects to
include all items a dded to the project file. You can also include items based on whether Include in
Report is selected in the object properties. Alter natively, to check on unreported items, you can
choose to include only items marked for exclusion (where Include in Report is not selecte d).
Select. This option allows you to provide project updates by selecting only
recent items in the
report. Alternativ ely, you can track older and perhaps unresolved issues by setting par ameters for
old items. Select all items to dism iss time as a paramete r for the report.
Order by. Yo u can select a combination of th e following objec t chara cteristics to order them
within a f older:
Type. Group object s b y type.
Name. Organize objects alphabetically.
Added date. Sort ob jects usin g the date they were added to the project.
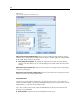
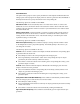
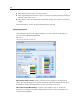
Saving and
Exporting Generated Reports
A report generated to the screen is displayed in a new output window. Any graphs included
in the report are displayed as in-line images.